
Personal Impacts Dashboard and Report
This interactive dashboard to showcases the personal impact these terminations had on respondents. Below is also a report with static images of the same information for readability, to publish, and for printability. There may be slight variations between data shown on tableau and in static images.
Personal Impacts Dashboard

Mental Health Impact
The unlawful termination of federal probationary employees did not just disrupt careers. For hundreds of respondents, these actions triggered mental health concerns. In the six months following their firing, respondents reported overwhelming rates of depression, anxiety, and trauma symptoms.
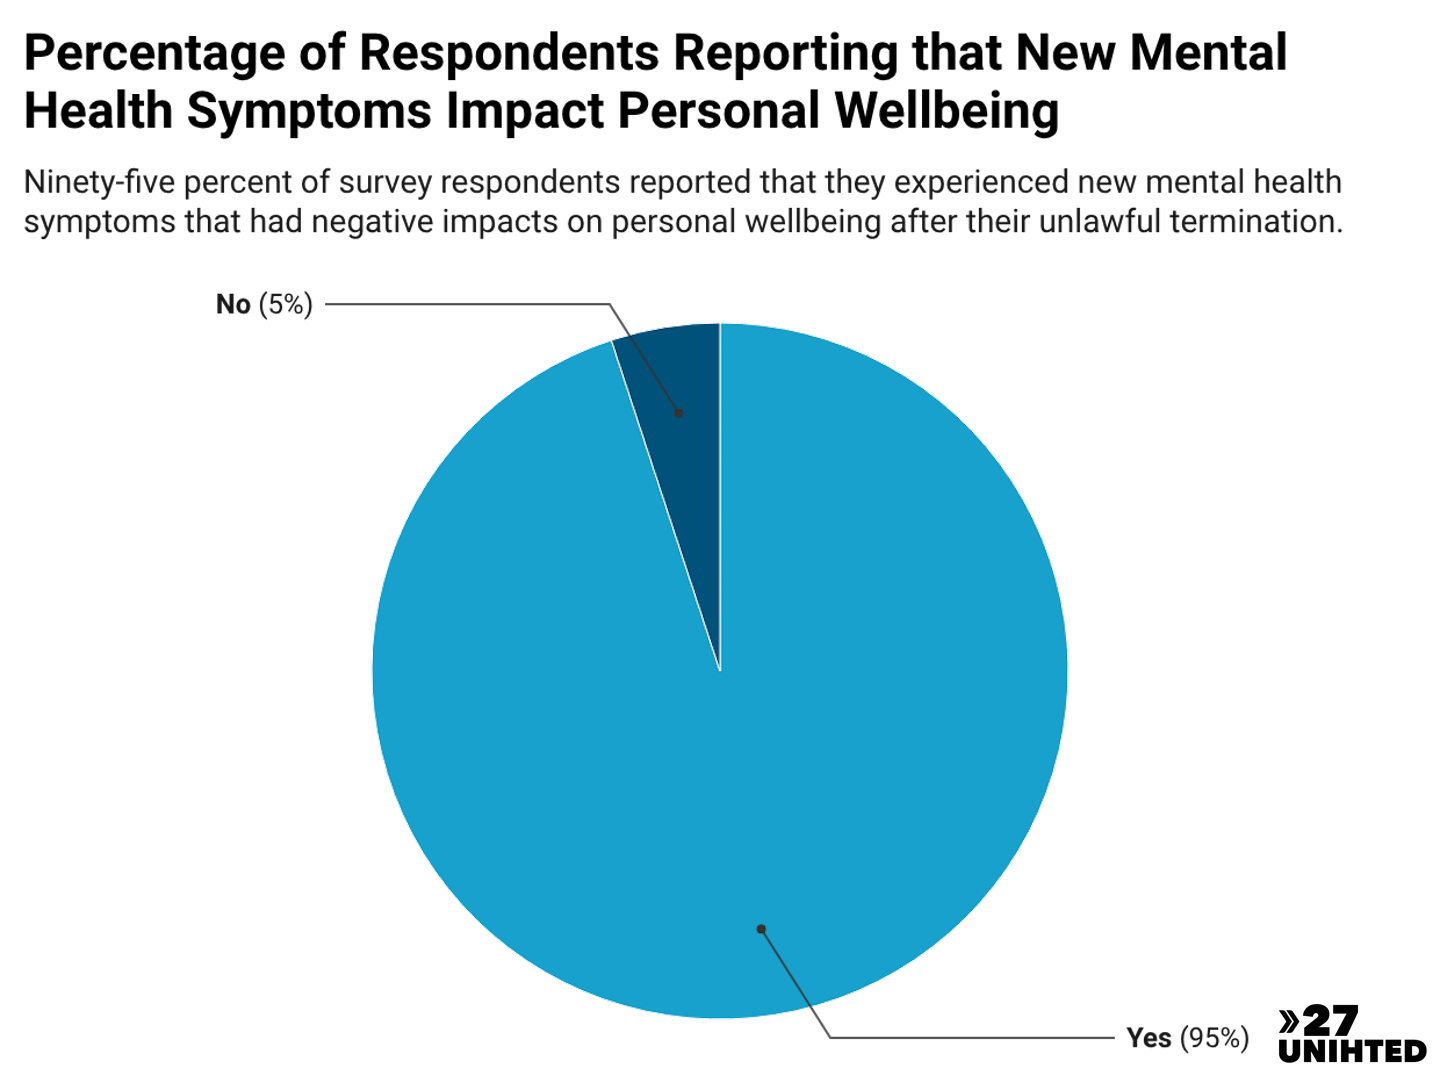
The impact on daily life was nearly universal. Ninety-five percent of respondents reported that new mental health symptoms affected their personal wellbeing, and 25% started new medication to manage conditions that resulted from their termination.
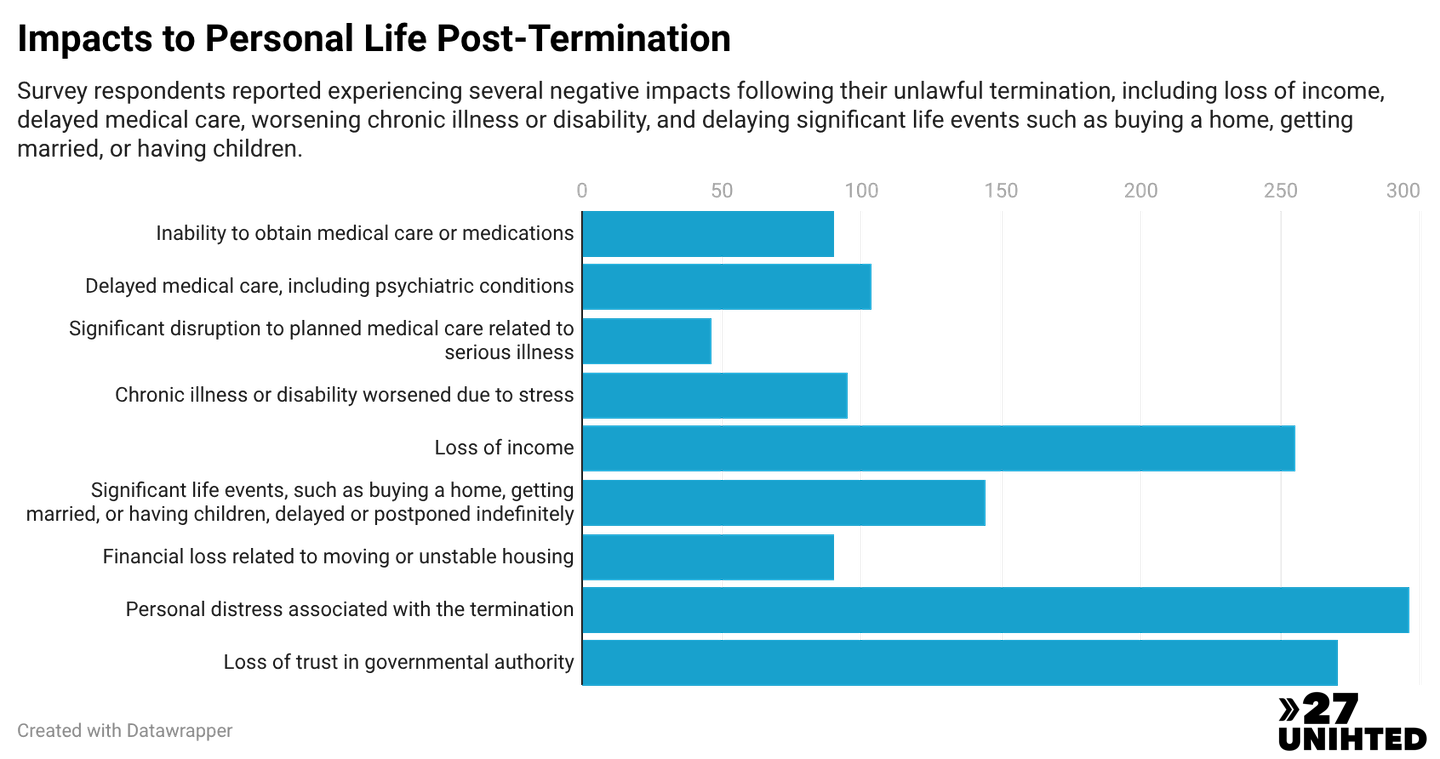
Material and intangible personal impacts resulted from these illegal firings. Nearly every survey respondent reported personal distress associated with the termination. Most respondents also lost trust in governmental authority, as well as loss their income.
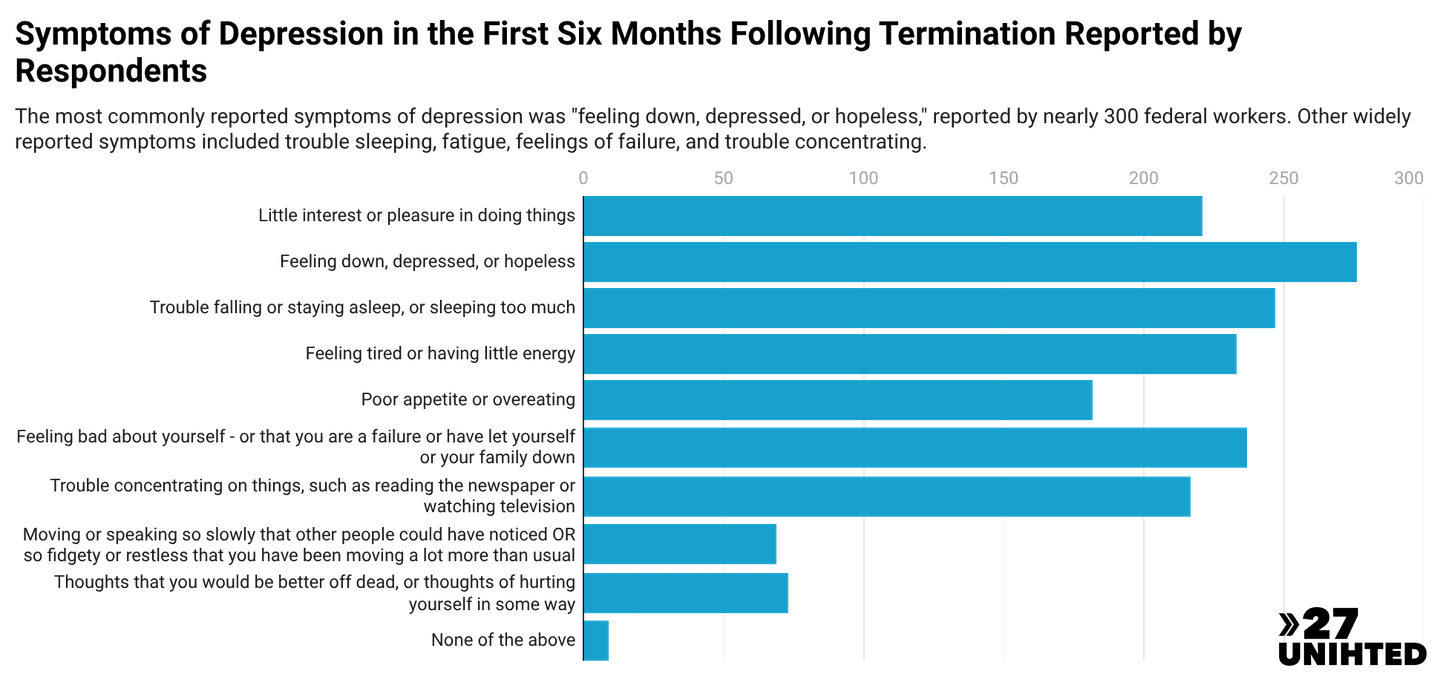
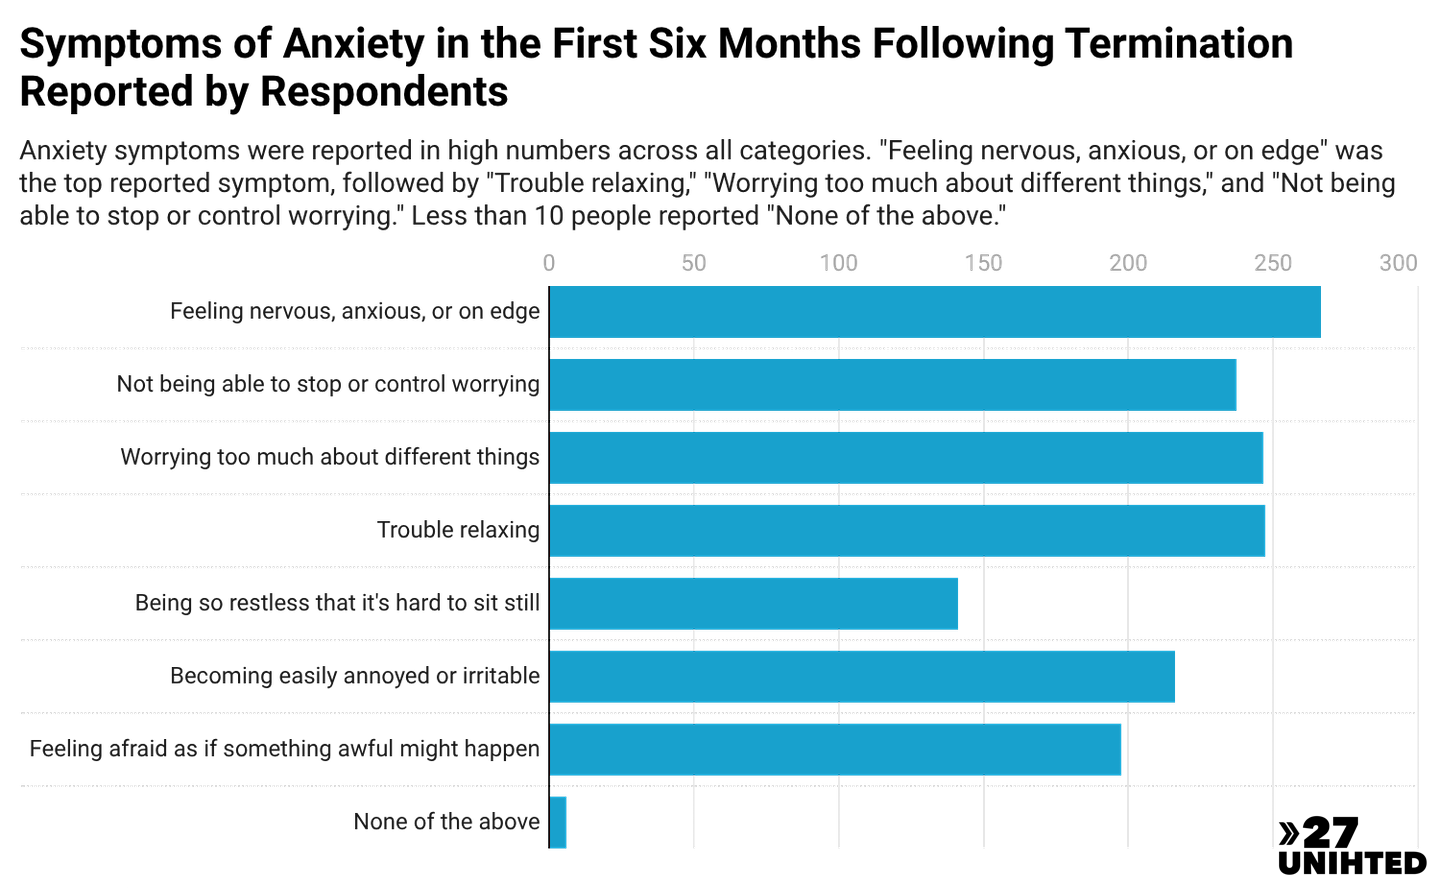
Depression symptoms were equally widespread; "feeling down, depressed, or hopeless" was reported by close to 300 respondents, making it the most commonly reported symptom across the entire survey. Symptoms of anxiety were also increased in this population.
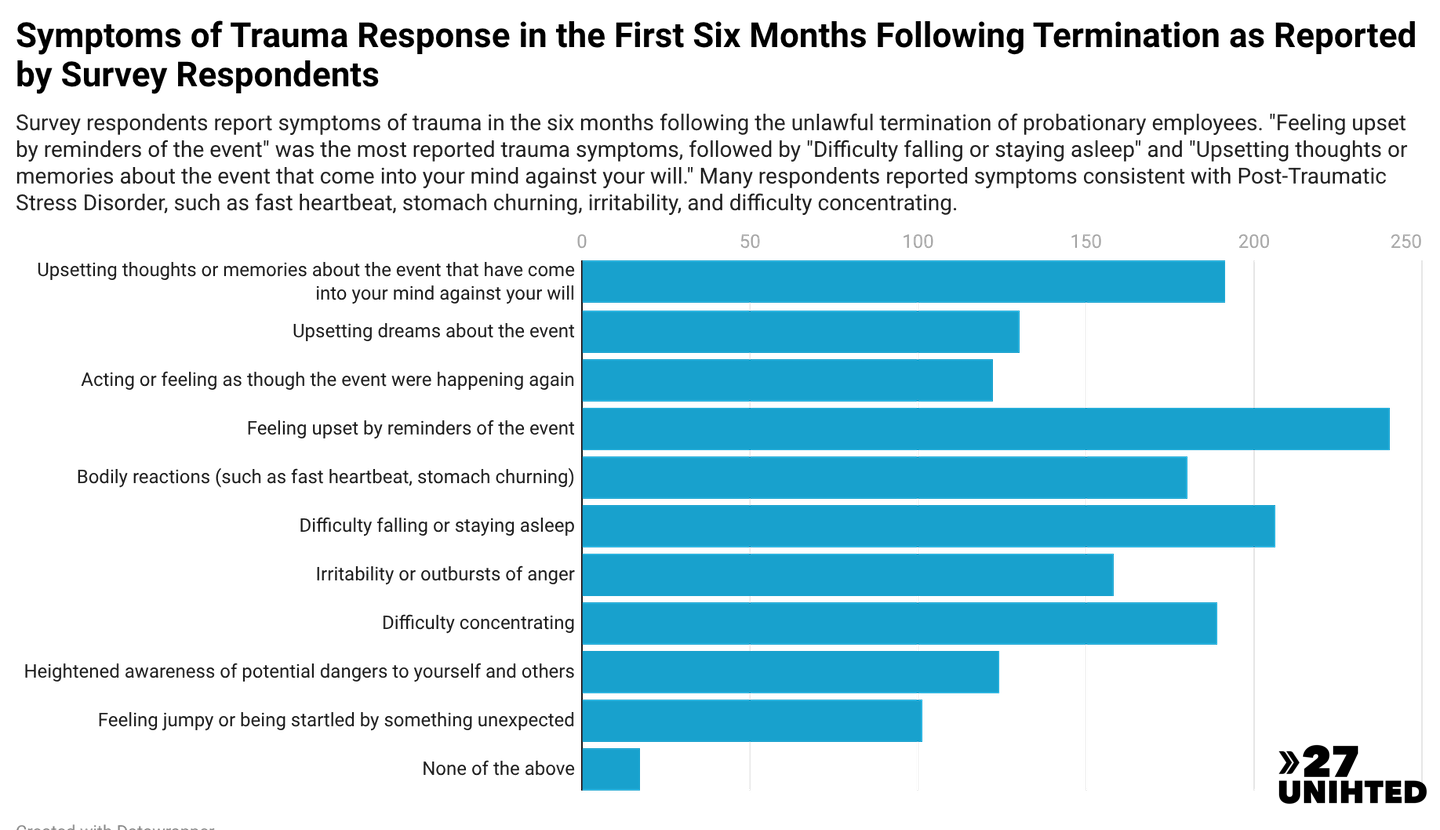
Respondents reporting trauma symptoms told a similarly alarming story. "Feeling upset by reminders of the event" was the most reported trauma symptom, followed closely by “difficulty sleeping” and “intrusive memories.” These are potential symptoms of post-traumatic stress disorder, and the data shows they were experienced at a large scale among respondents.
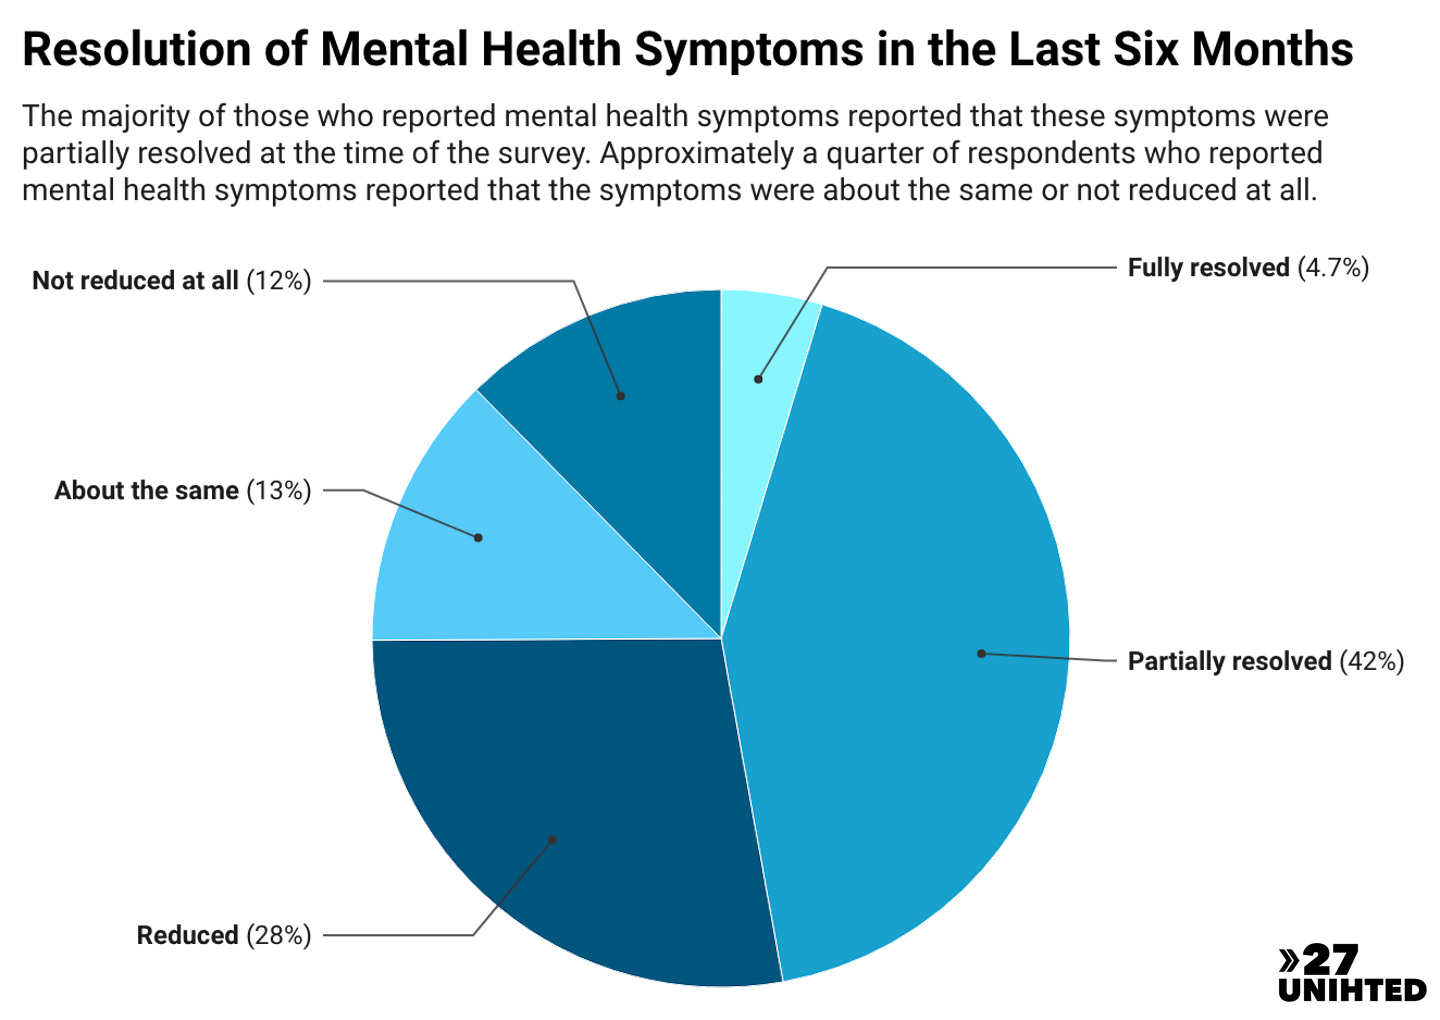
When asked whether their mental health symptoms resolved, very few respondents reported full resolution. The largest group reported symptoms only “partially resolved,” with significant numbers reporting their symptoms were either “reduced,” “about the same,” or “not reduced at all,” indicating that for many respondents the damage done by these firings is still felt today.
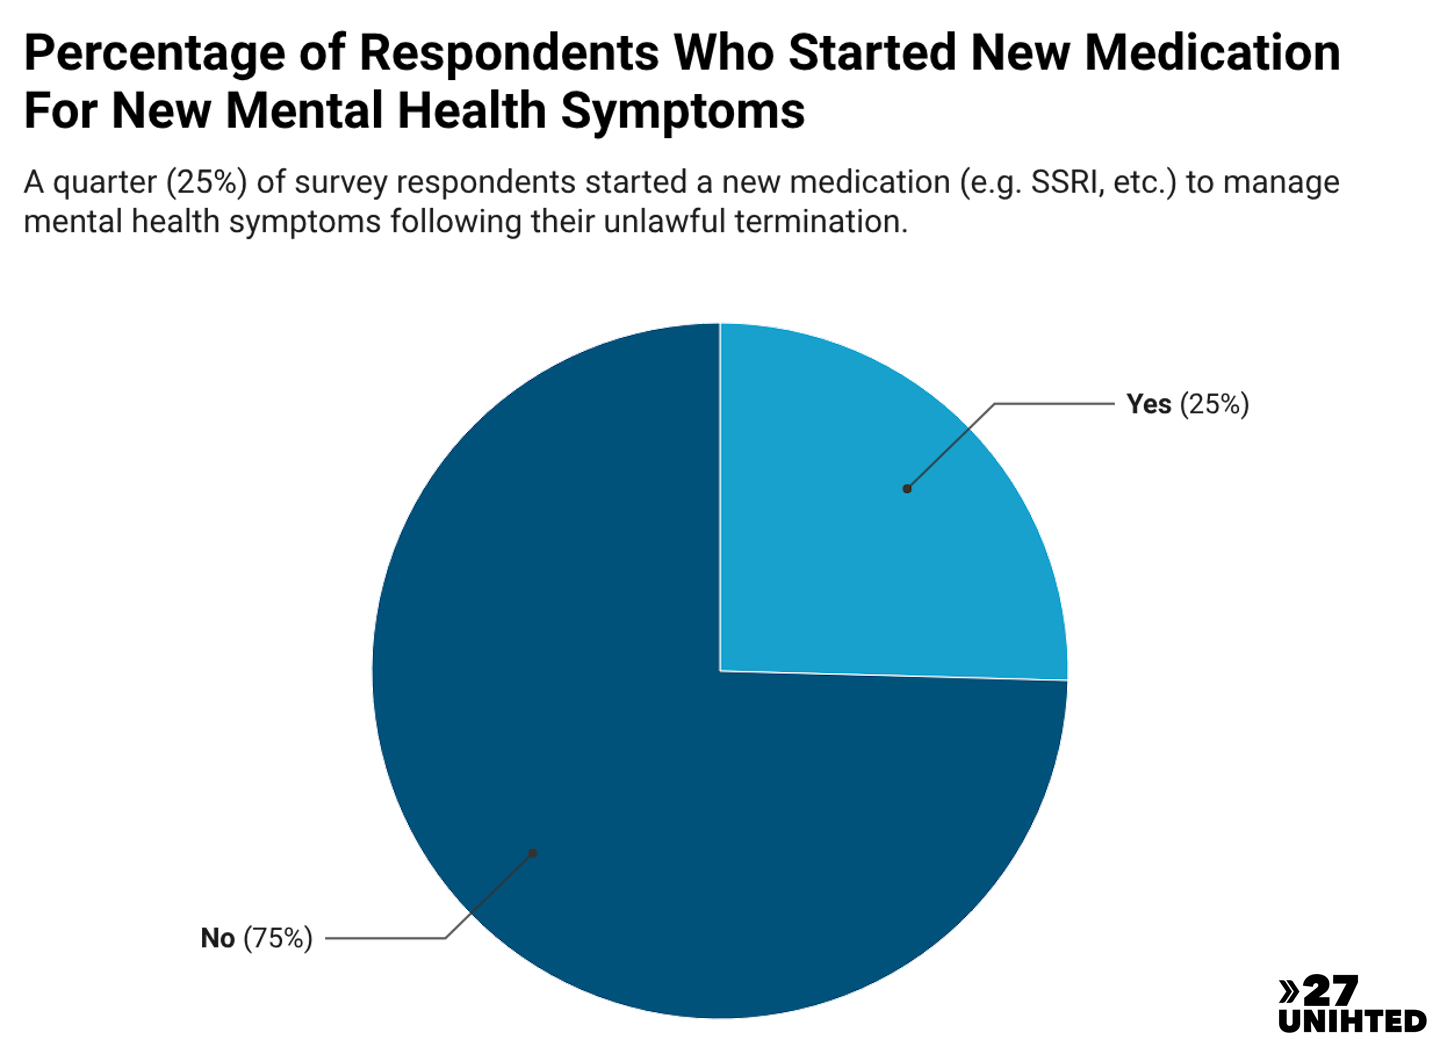
A number of respondents also reported taking a medication to deal with their new mental health symptoms over the past year.
Economic Impacts
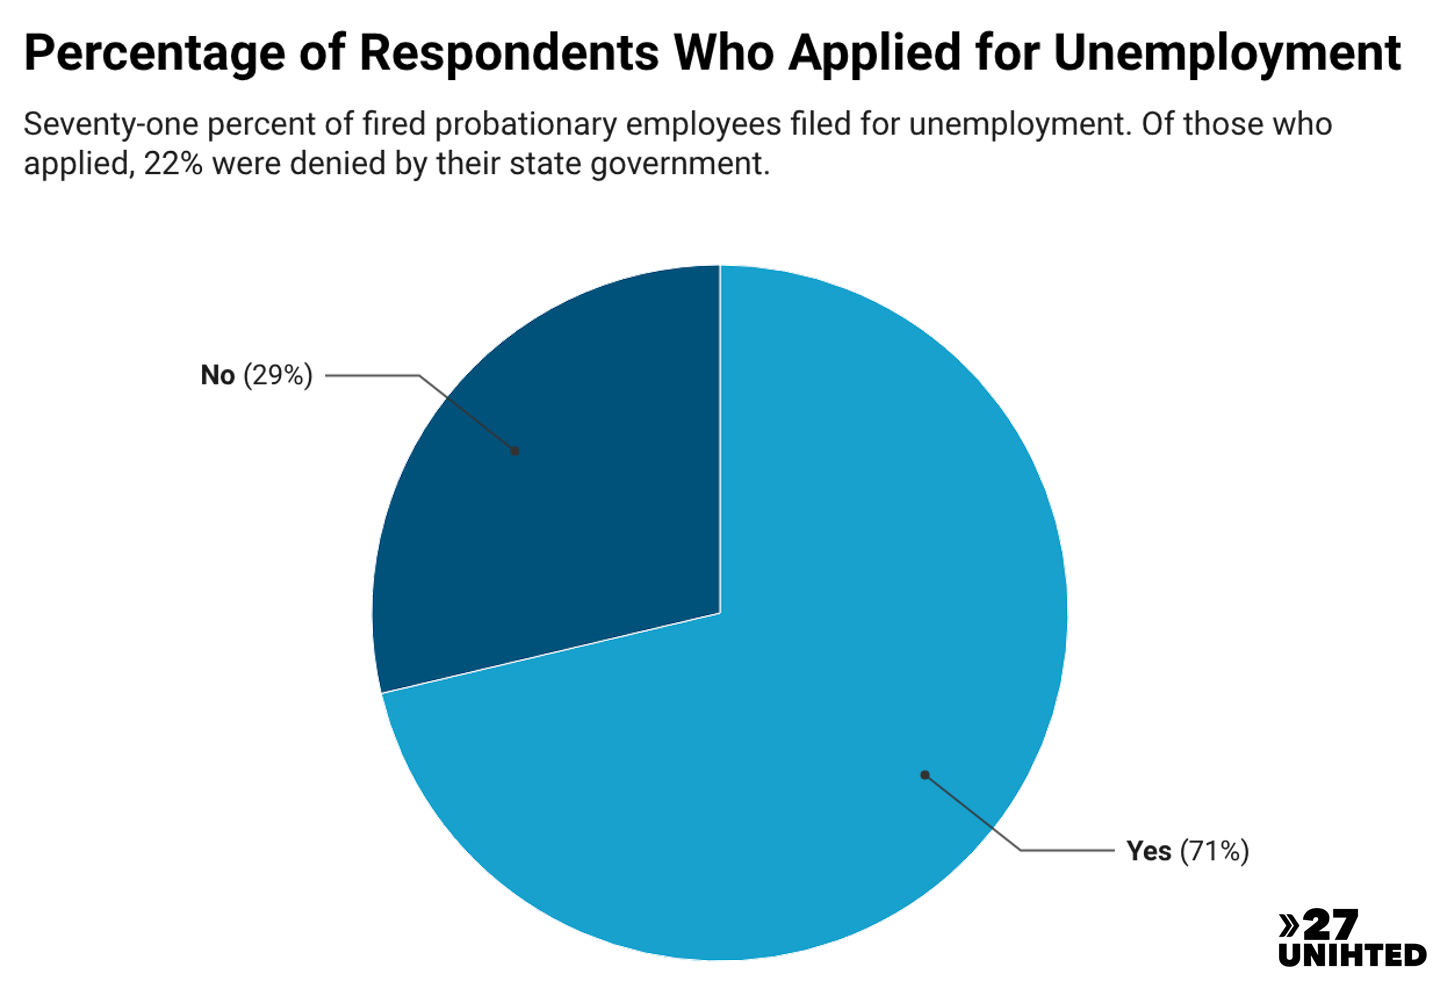
Unfortunately for respondents, many also faced economic challenges as well as emotional. After being fired, 71% filed for unemployment benefits, and of those that applied for unemployment, *22% were denied unemployment by their state.
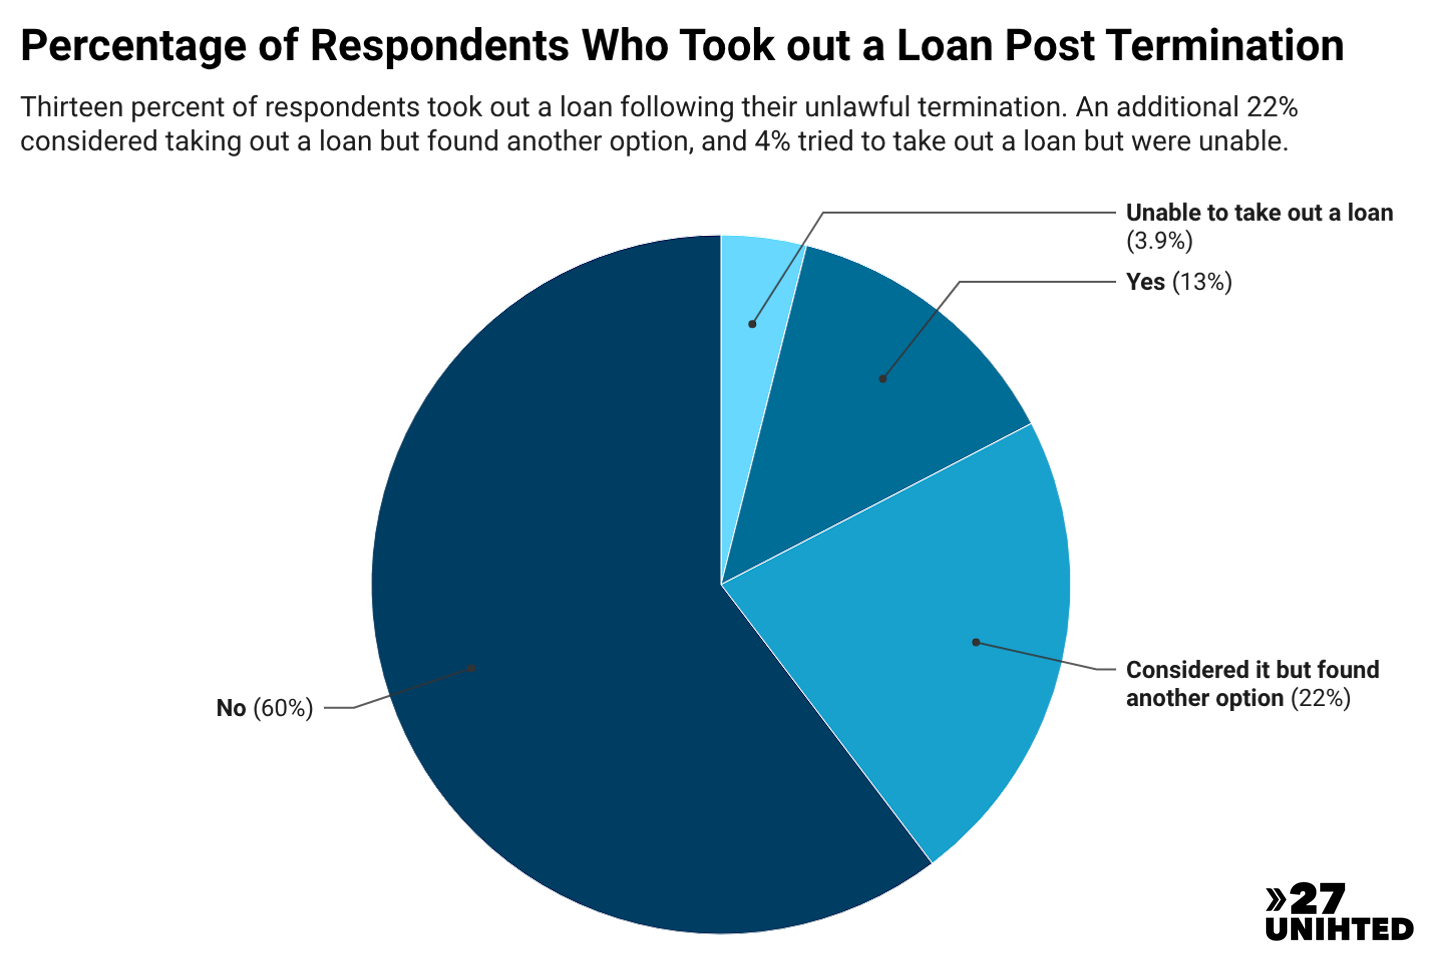
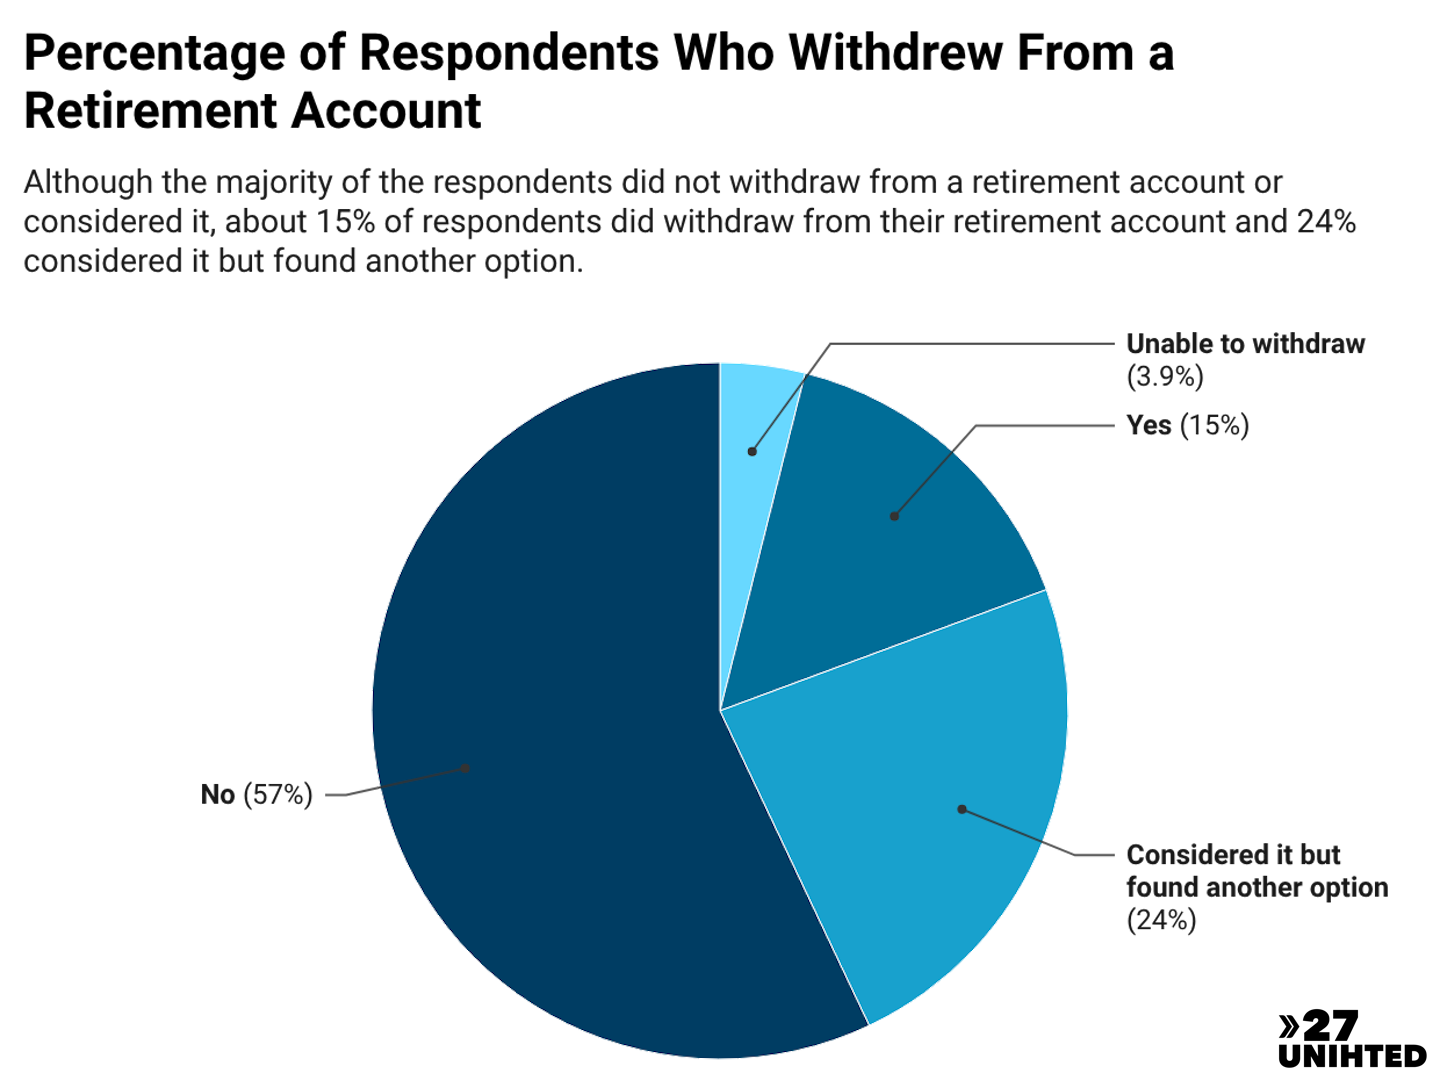
Thirteen percent of survey respondents also took out a loan and 15% withdrew from their retirement savings.
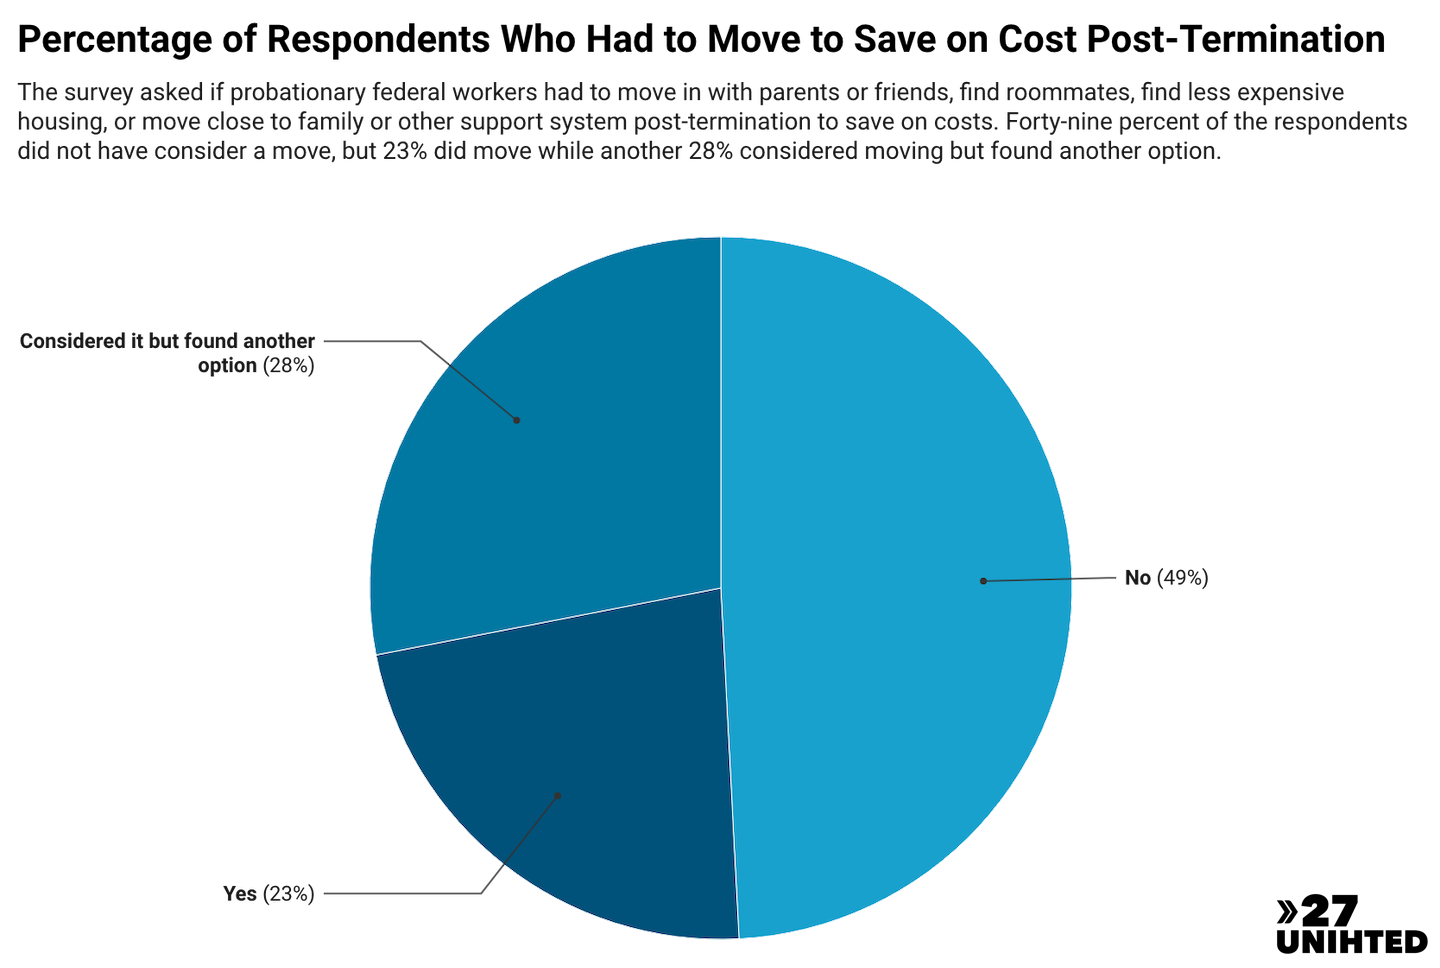
About 27% of respondents had moved for their federal job prior to their termination. It was also asked if anyone had to move after their termination to save on costs.
About 22% responded they had moved in with parents or friends, found roommates, found less expensive housing, or moved closer to family or other support systems.
Another 28% considered moving but found a way to stay in their home, while 49% did not have to consider moving.
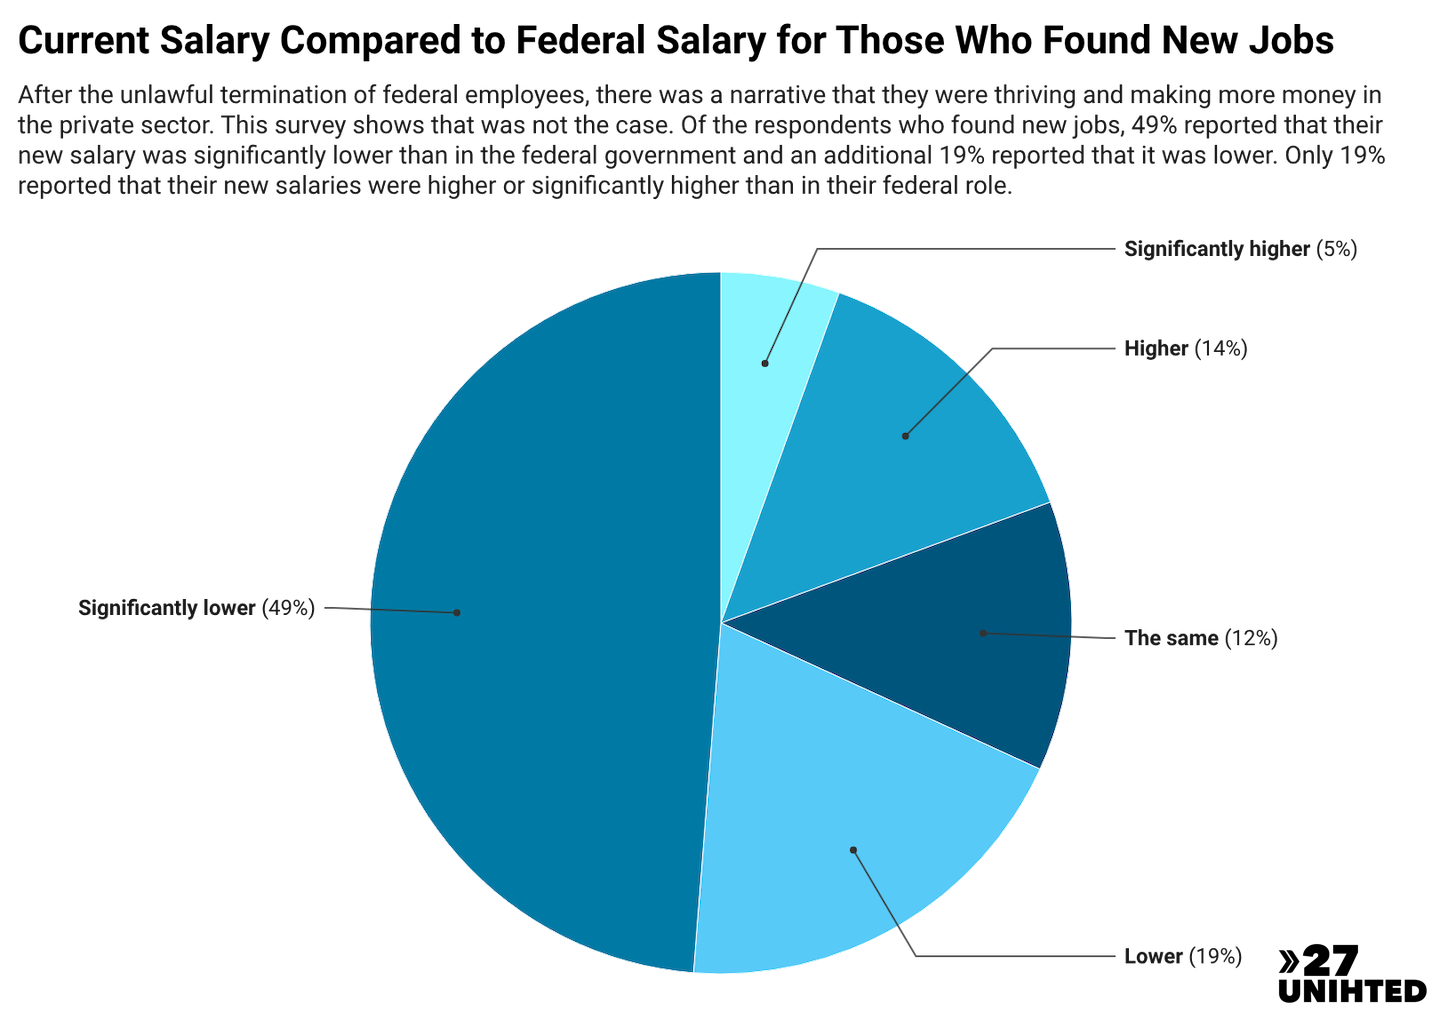
Sixty-eight percent of those who are currently working reported that their new salary is “lower” or “significantly lower” than their previous government salary.
Conclusions
These graphs demonstrate that respondents were emotionally and financially impacted by their firings. They reported symptoms of depression, Trauma and anxiety, as well as feeling a lack of resolution. Some required a new medication to deal with health symptoms resulting from their unlawful firing. Some had to take out loans and or borrow from their retirement funds.
*Disclaimer: The survey did not request that respondents provide personal identifying information (PII), and results are published as aggregated responses for each question. Organizers did not verify the identity or status of respondents, and respondents self-selected to participate. No single question required an answer. Thus, the percentages for each question share only the respondents’ answers for that particular question, meaning the totals vary throughout the results. Respondents did not receive an incentive to complete the survey; participation was completely voluntary. This is not a research project.