
Career Impacts Dashboard
This interactive dashboard to showcases the personal impact these terminations had on respondents. Below this is a report with static images of the same information for readability, to publish, and for printability. There may be slight variations between data shown on tableau and in static images.
The human cost behind these numbers is profound. These were not workers who could easily pivot to comparable private sector roles. Many had spent their entire careers developing highly specialized expertise in fields like marine science, public health research, environmental law, and national security; skills that have limited direct equivalents outside of government.
Many worked as a contractor in these areas for a significant amount of time (refer to our graphs on the “Impacts to the American Public” page). For them, this firing was not a setback; it was a rupture to their career trajectory.

Job Search and Employment Status
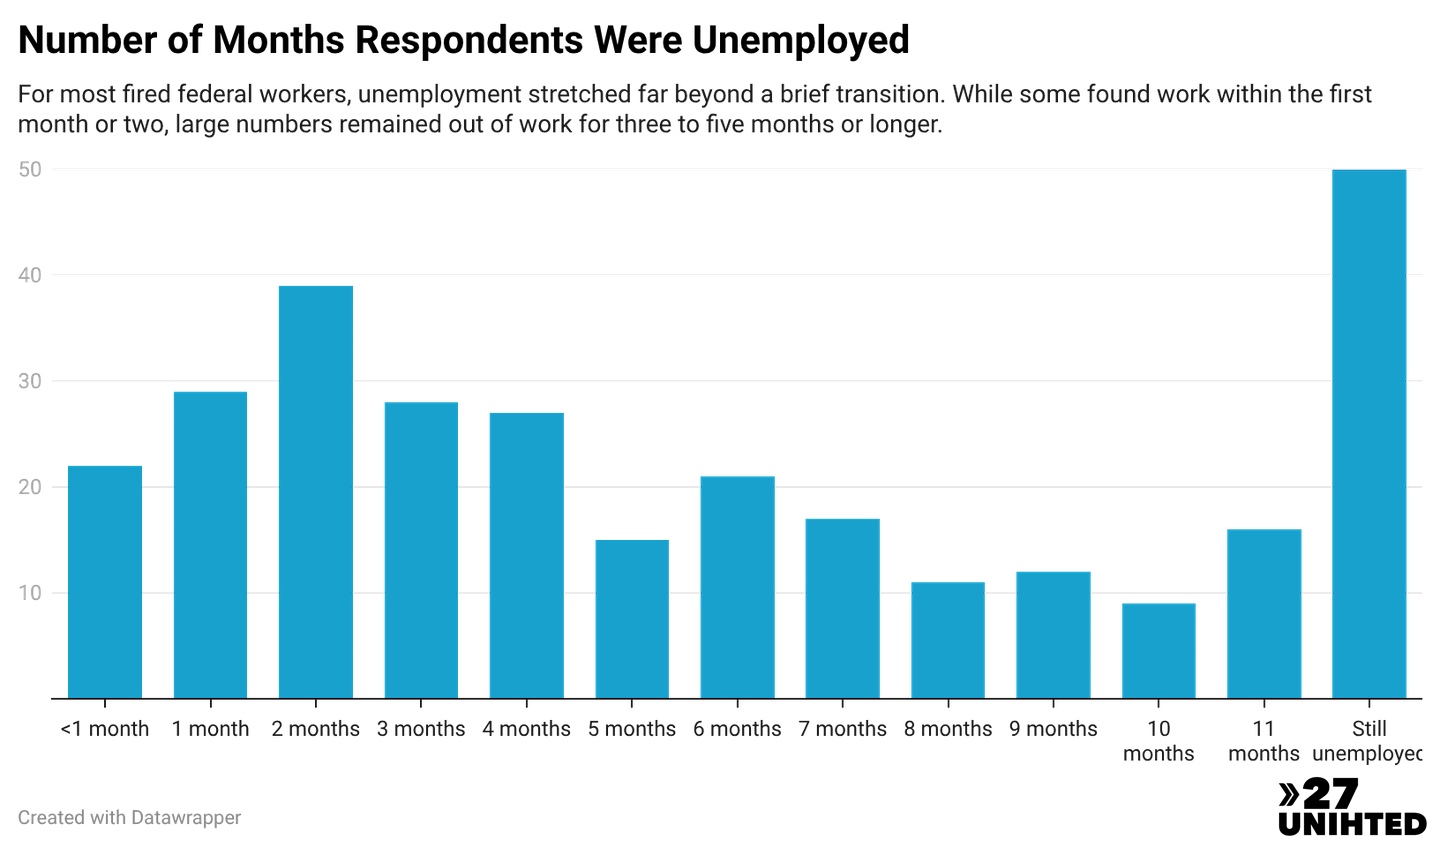
Unemployment was not a brief transition for most respondents. While some found work within the first month or two, large numbers remained out of work for four, five, six months, or longer. The largest single group in the entire dataset were those who were still unemployed at the time of the survey, nearly a full year after being illegally fired.
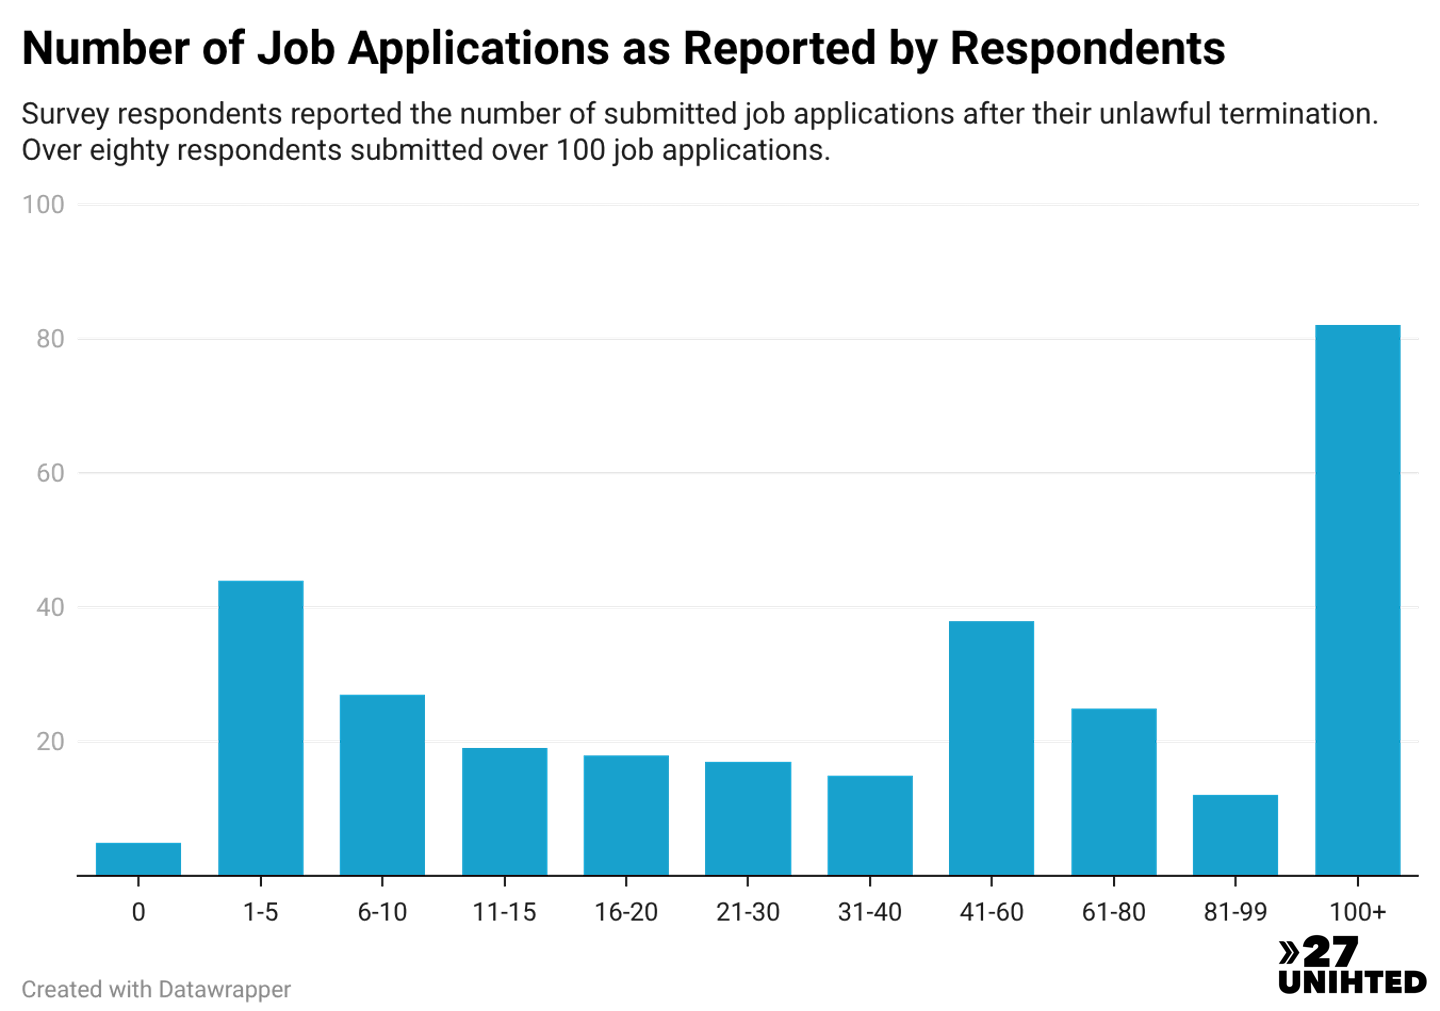
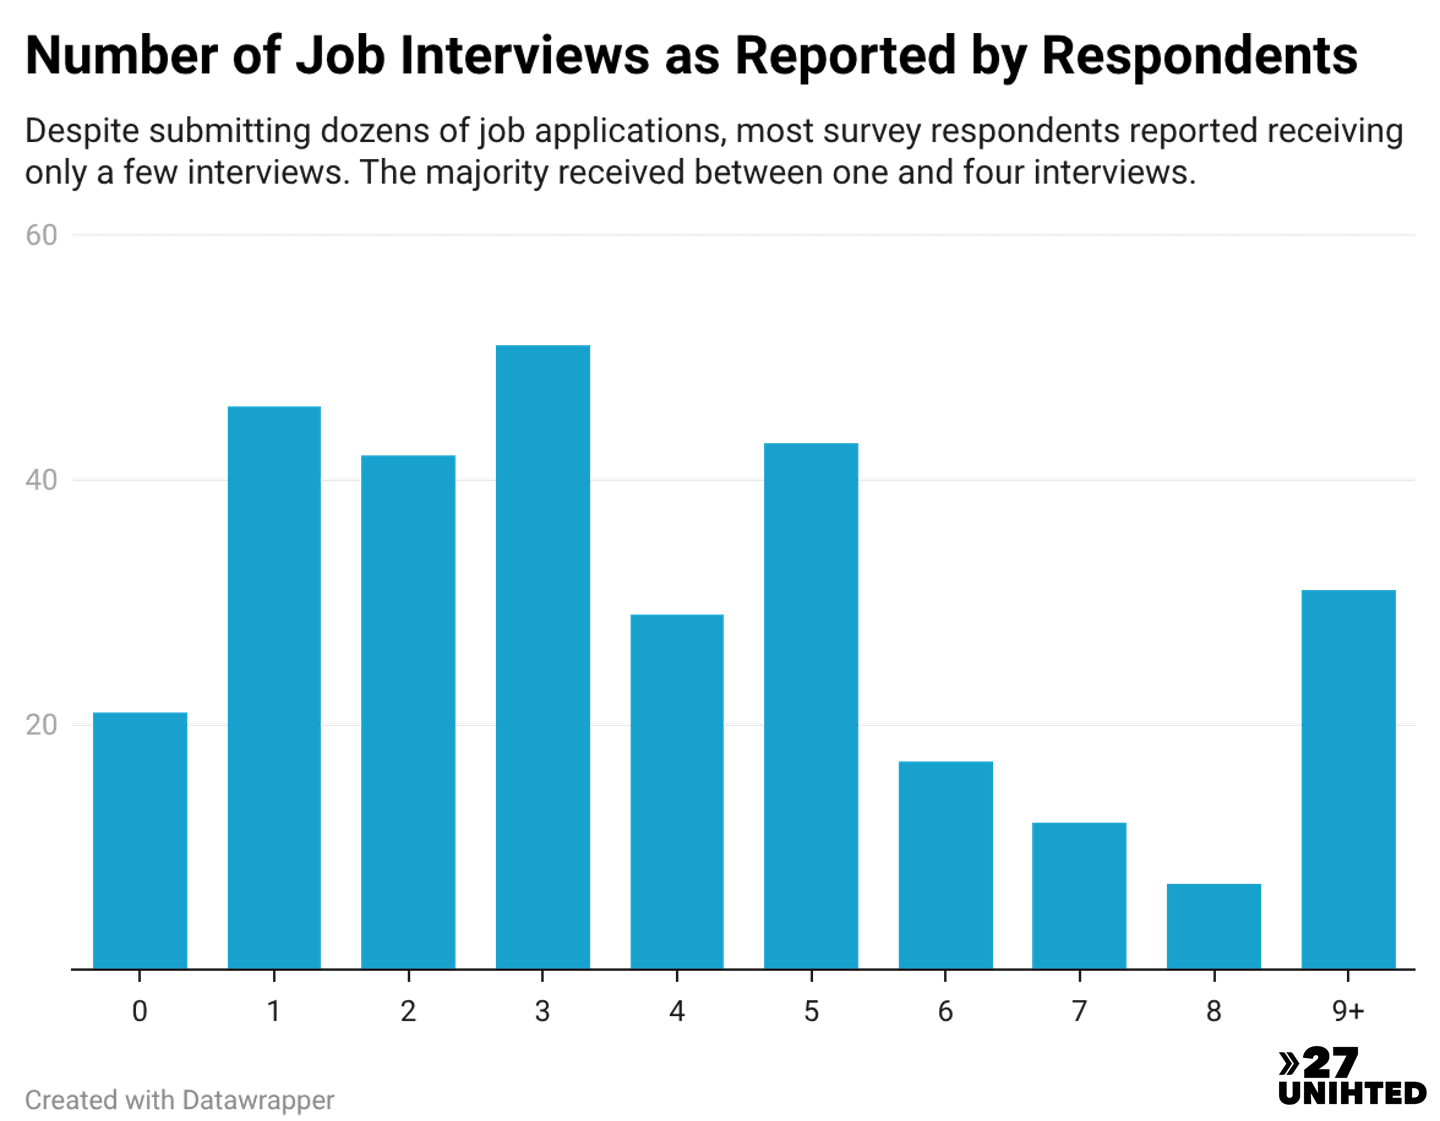
The job search data tells a story of exhaustion and repeated rejection. The largest group of fired federal workers reported submitting over 100 job applications in their search for new work, with many submitting far more. Despite this effort, interviews were hard to come by, with most workers reporting only a handful of interviews.
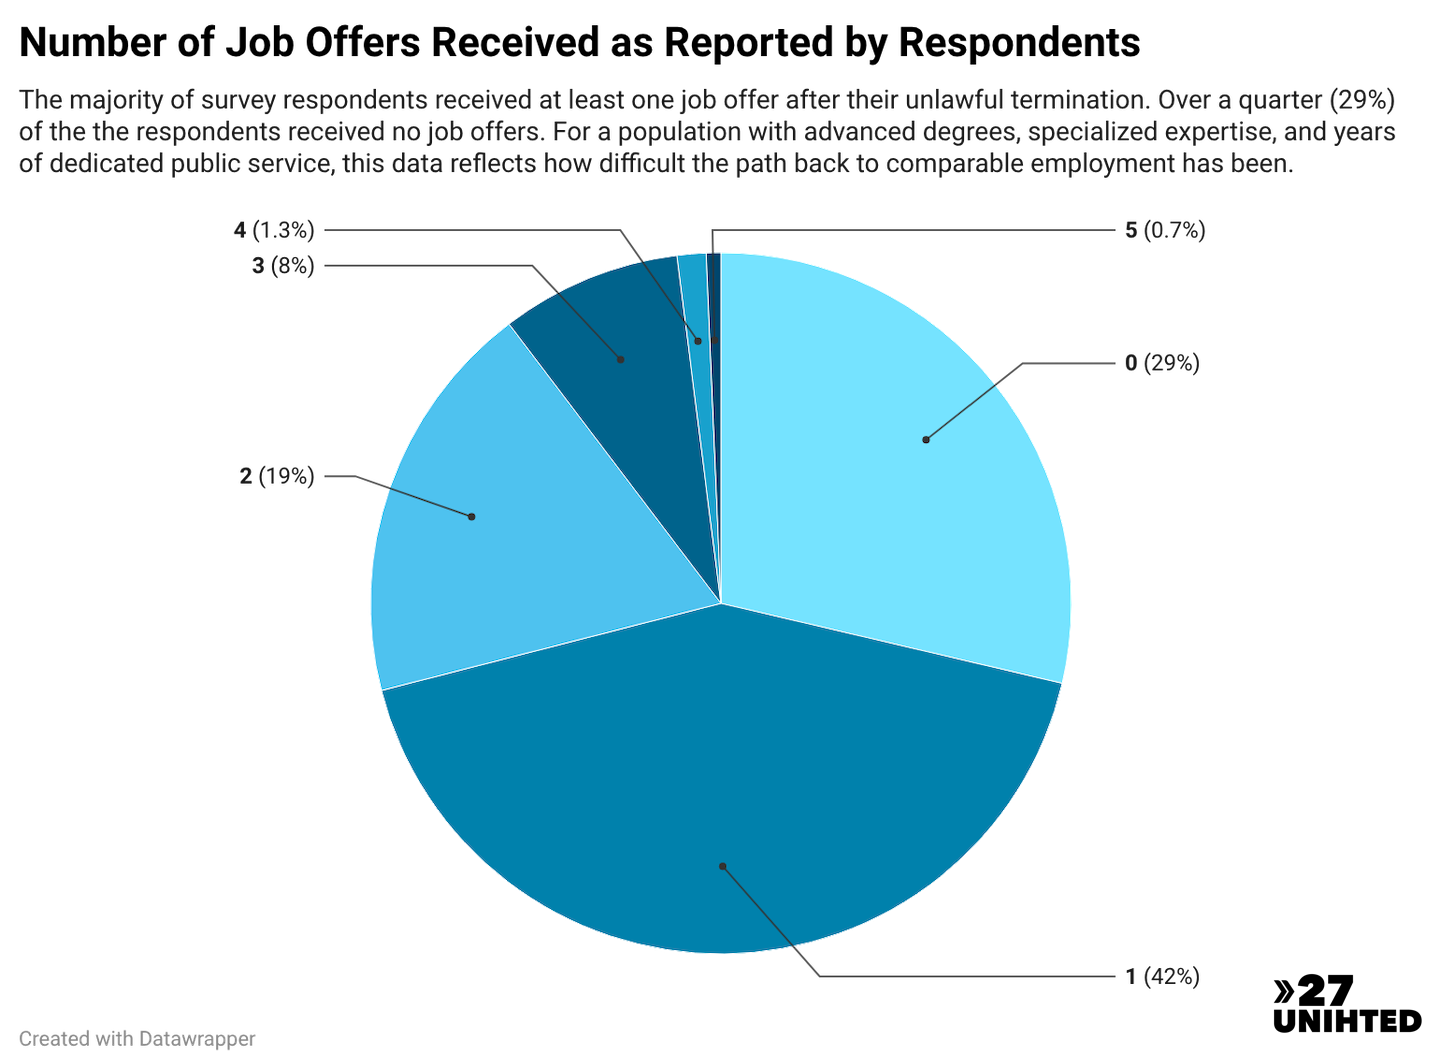
Job offers were even scarcer, with the majority receiving just one, and a high number receiving none at all.
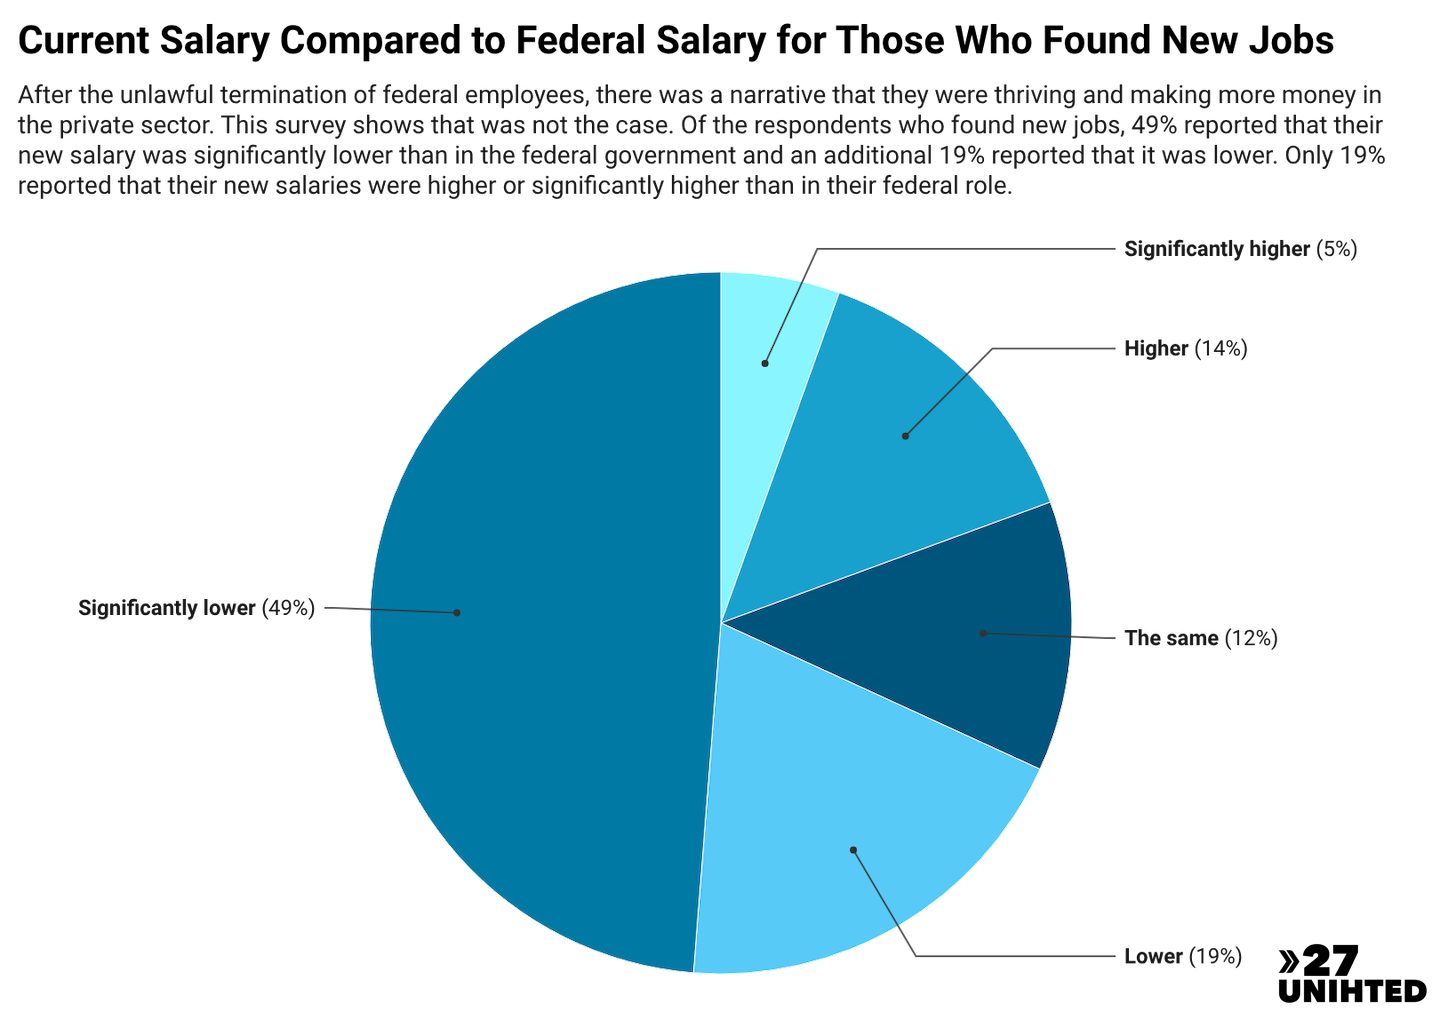
For those who did find new employment, the financial toll was severe. Forty-nine percent saw their salary drop significantly, and an additional 19% took a pay cut. In total, nearly 68% of those who found work earned less than they did in their federal roles. Only a small fraction landed positions at the same or higher pay
Career Interruptions
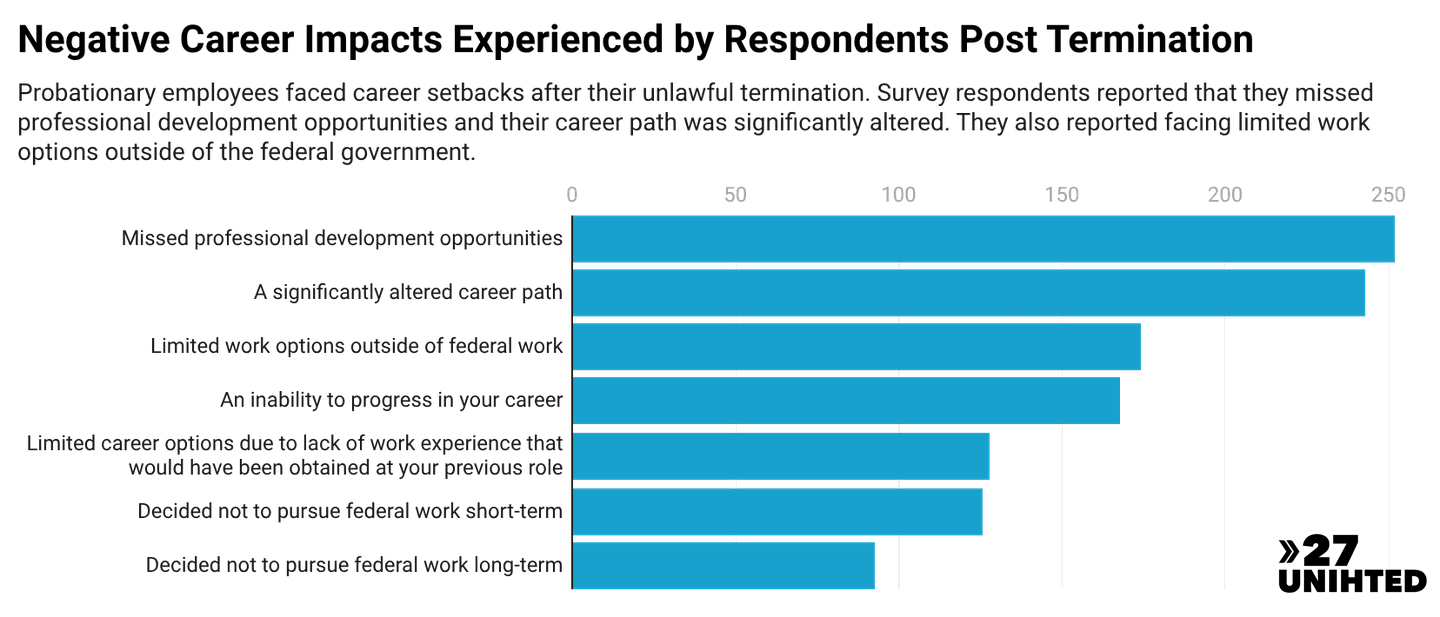
The data makes clear that re-entering the workforce after federal employment was far hard for respondents. The most commonly reported career impact was missed professional development opportunities, cited by hundreds of respondents. Nearly as many reported a significantly altered career path, followed by limited work options outside of the federal workforce and an outright inability to progress in their careers. A significant number also reported that they decided not to pursue federal work again, either in the short or long term, representing damage to the federal workforce that will persist for years.
Reinstated Respondents
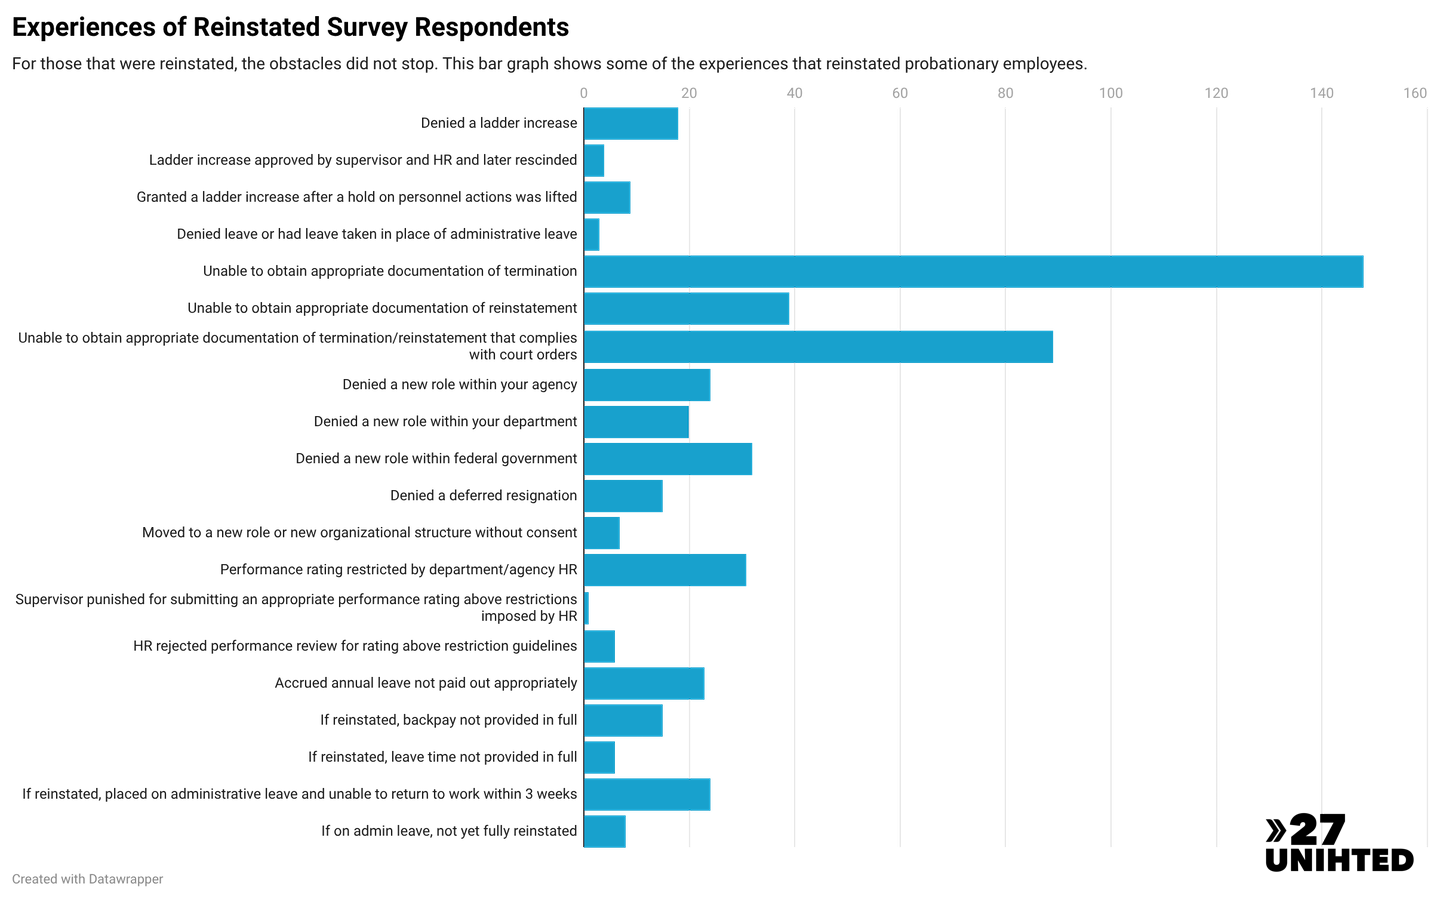
The obstacles did not end for workers who were reinstated following court orders. One hundred and forty-eight individual respondents reported being unable to obtain appropriate documentation of their termination. Eighty-nine could not obtain documentation of their termination or reinstatement that complied with court orders. Thirty-two were denied a new role within the federal government entirely. Performance ratings were restricted, backpay was withheld, and some workers were placed back on administrative leave and still blocked from returning to work, sometimes for weeks.
Only about 11% of fired probationary workers returned to a role with the federal government. This represents a profound and lasting loss of public service talent from which the government may never recover.
Conclusions
For many who responded to this survey, the job market has been long and difficult, and failed to provide financially in the same way as their federal role. Many feel their career trajectory was impacted, and pursued work outside the field where they worked as federal employees. Many who were reinstated do not feel safe, and many found new work outside of the federal government.
All of this points to losses in the federal workforce and potential broad impacts to local economies through sustained unemployment. Job losses nationally were high over the last year, and losses to a qualified federal workforce puts further strain on a difficult job market,
*Disclaimer: The survey did not request that respondents provide personal identifying information (PII), and results are published as aggregated responses for each question. Organizers did not verify the identity or status of respondents, and respondents self-selected to participate. No single question required an answer. Thus, the percentages for each question share only the respondents’ answers for that particular question, meaning the totals vary throughout the results. Respondents did not receive an incentive to complete the survey; participation was completely voluntary. This is not a research project.