
Introduction to Probationary Respondents
This interactive dashboard to showcases the personal impact these terminations had on respondents. Below there is a report with static images of the same information for readability, to publish, and for printability. There may be slight variations between data shown on tableau and in static images.

Respondent Locations and Workplaces
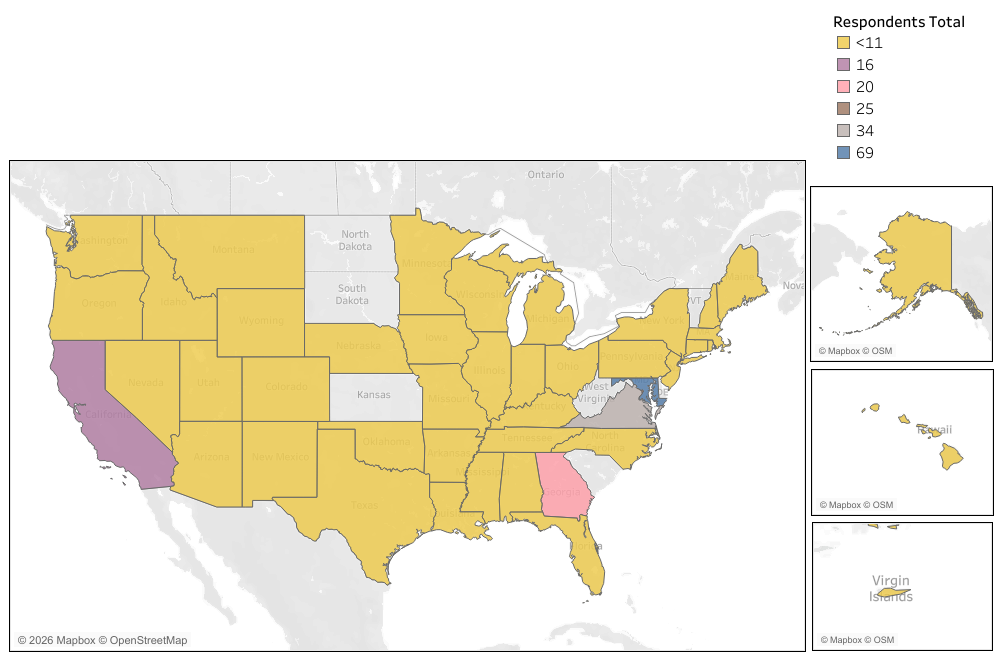
Respondents were located across 43 states and the U.S. Virgin Islands. In this map, any state that had from 1 to 10 respondents is shown as <11, to protect identities of respondents.
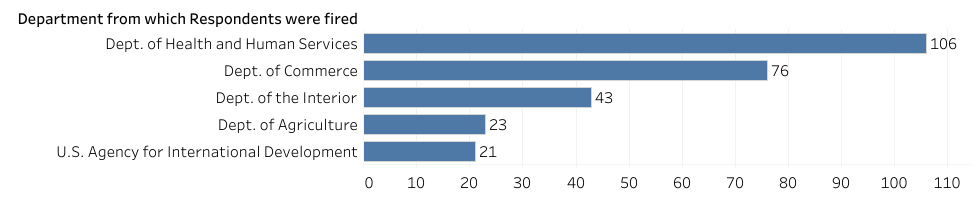
We received responses from fired probationary employees who had worked in 12 different departments and 15 different agencies, bureaus and subgroups. To protect respondents’ anonymity, we chose to display only the responses from the five departments from which we received the most responses.
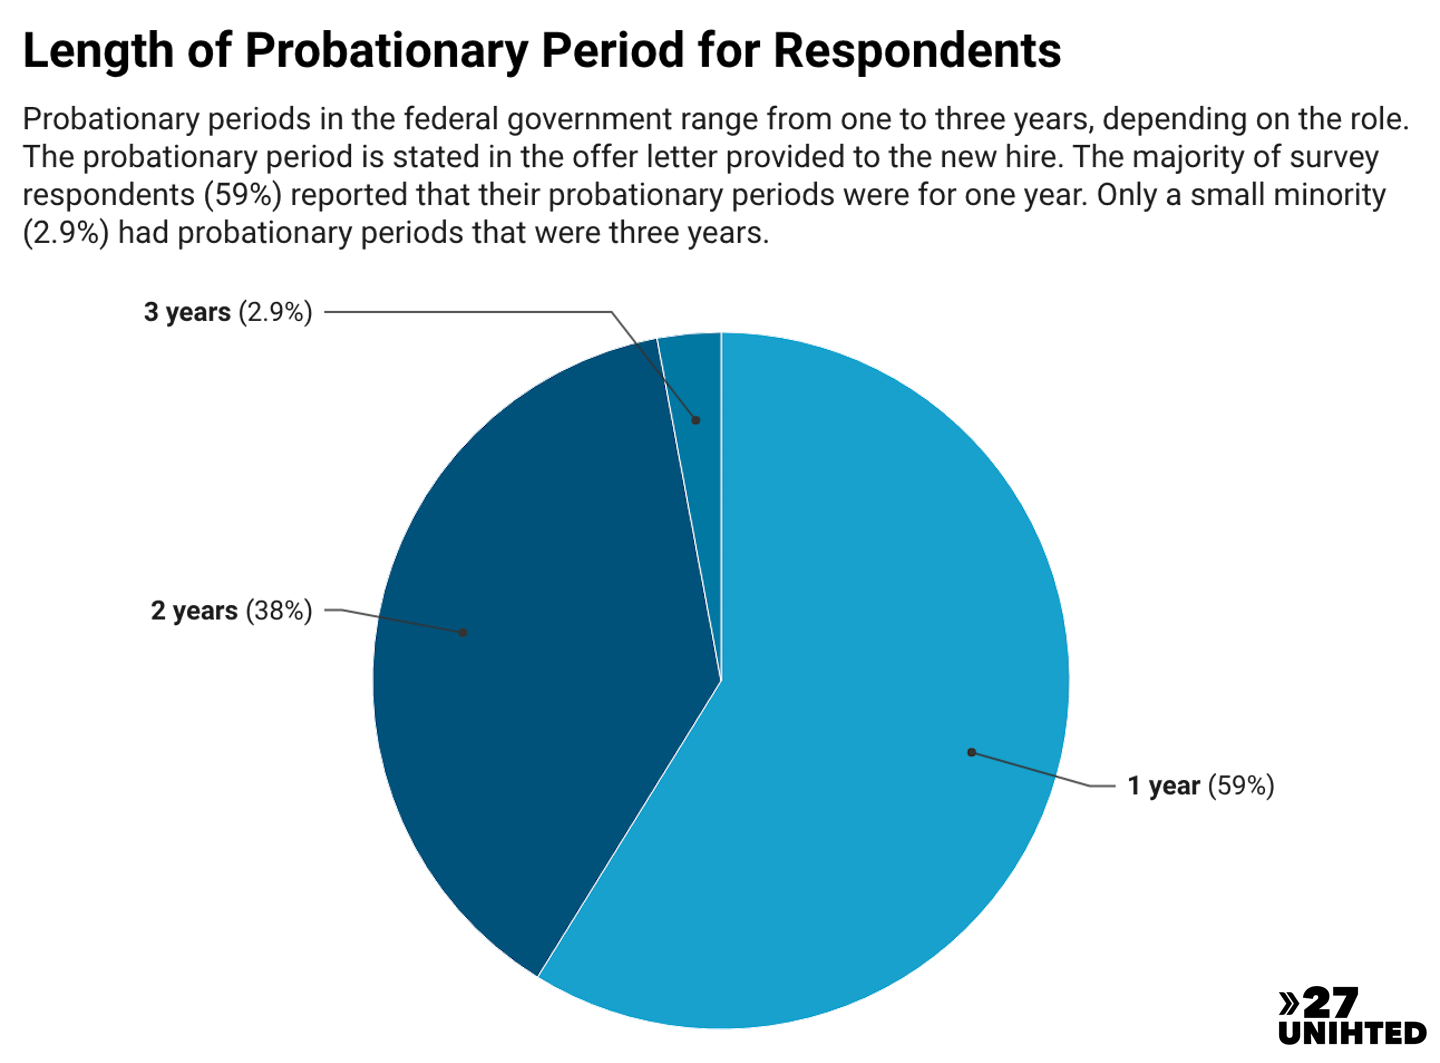
Length of Probationary Period
In the federal government, a probationary period is required any time an employee begins a new posting, even if they have worked in government for years in a parallel role or as a contractor.
Probationary periods in the private sector are different than the federal sector. In the federal sector there is no "getting another job in a different agency." In the private sector, individuals can seek work without a probationary employment trial period, and many are hired as at-will employees, meaning they can be fired at any time. In the federal sector, it is a law that new federal employees serve at least a one-year probationary period. These individuals do the work of a full-time employee for the entirety of their probationary period, and they are also a protected class of federal workers.
Most survey respondents were in the midst of a one-year probationary period, but some were close to completing their two- or even three-year probationary periods. The survey indicates that many of these employees worked at their agency for multiple years prior to their termination notification.
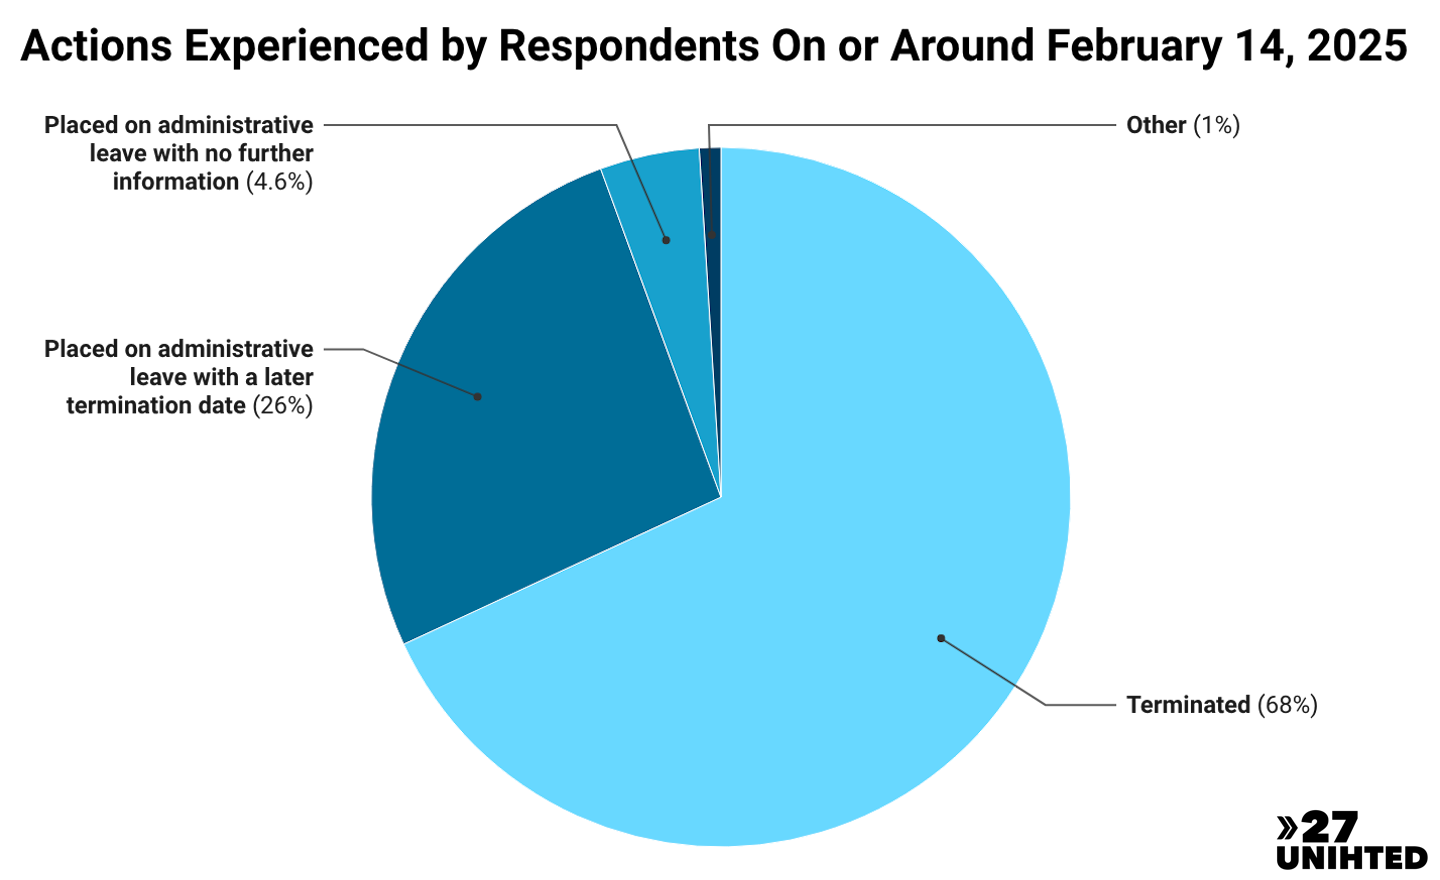
Government’s Actions in February 2025
Over half of survey respondents (68%) were terminated from their federal positions on or around February 14, 2025. Others were placed on administrative leave and terminated at a later date, or simply told they were on administrative leave with no further details.
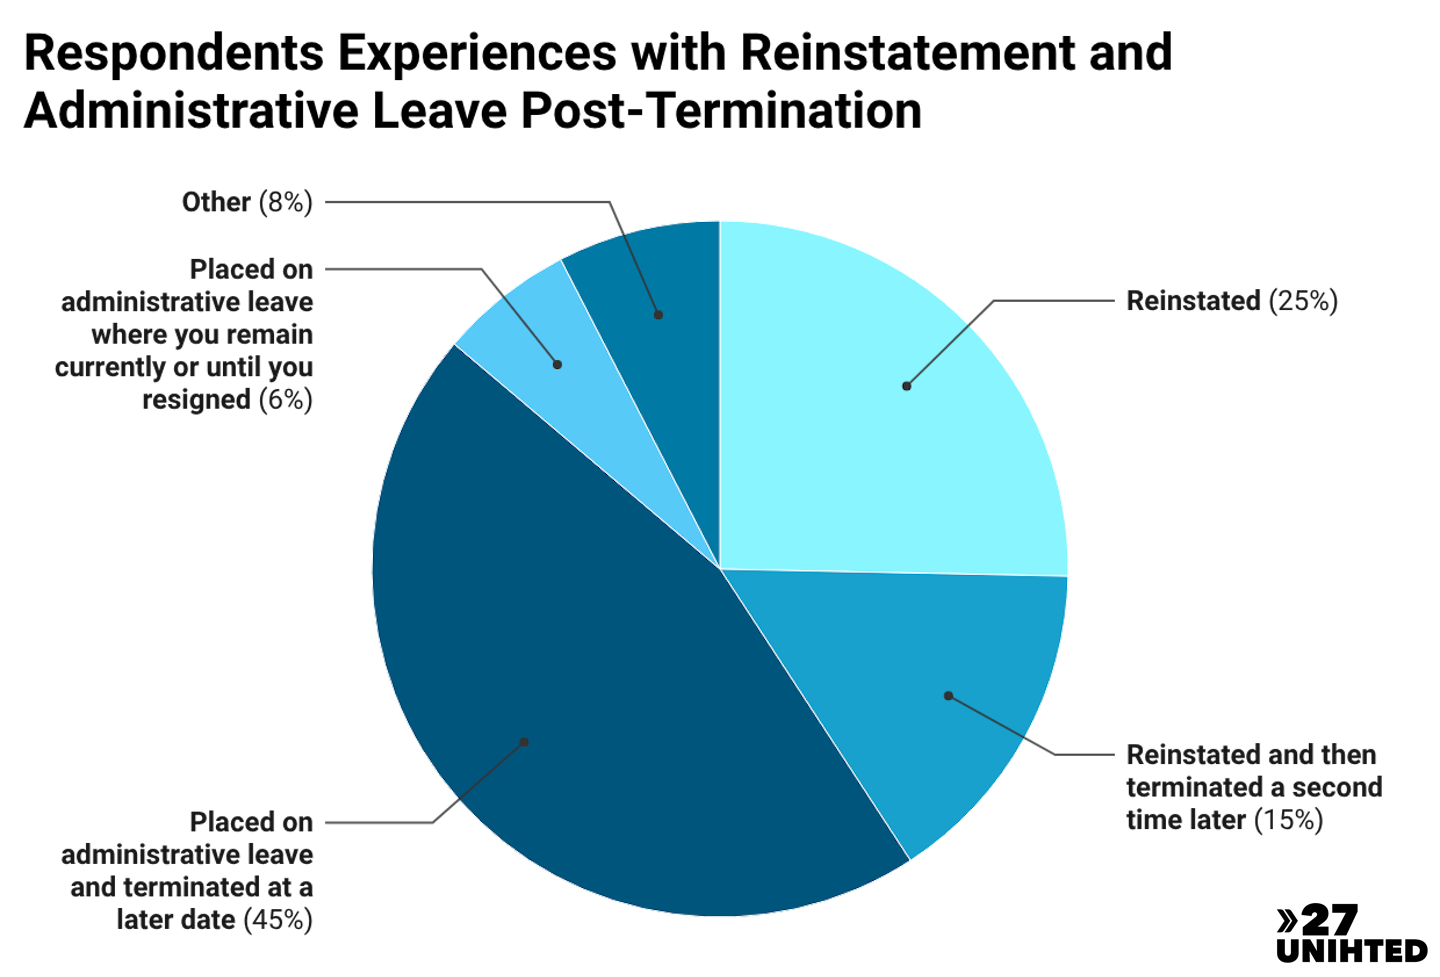
Following the initial terminations, it was reported that agencies realized they had terminated critical workers. Respondents were asked about their agencies’ actions in the days and weeks following February 14. About 25% of respondents were reinstated in their roles with another 15% who were reinstated only to be terminated again later. About 45% of respondents were placed on administrative leave (paid leave) and terminated at a later date. Finally about 6% of respondents were placed on administrative leave and they were either still on administrative leave as of January 31, 2026 or they had resigned.
Those in the "other" categories shared different variations of being reinstated, brought back on leave (again), and fired again. This is demonstrative of a lack of planning across the government.
Most of those who were reinstated were allowed to return to their jobs by court order (58.8% of reinstated respondents). Some departments continue to push back against court orders to reinstate fired probationary employees, even though the courts ruled that these firings were unlawful.

Conclusions
Survey respondents were federal probationary employees from across the country and various government agencies. Collectively, they had decades of experience and were serving long probationary periods within the federal government.
There was no uniformity among agency responses (such as reinstatements), and respondents’ quotes confirm the confusion and disappointment sown as a result of these inconsistencies.
*Disclaimer: The survey did not request that respondents provide personal identifying information (PII), and results are published as aggregated responses for each question. Organizers did not verify the identity or status of respondents, and respondents self-selected to participate. No single question required an answer. Thus, the percentages for each question share only the respondents’ answers for that particular question, meaning the totals vary throughout the results. Respondents did not receive an incentive to complete the survey; participation was completely voluntary. This is not a research project.