
Career Impacts Dashboard
We created both an interactive dashboard and static report for publishing etc.
Hello, World!
Career Impacts
For the federal workers caught in the unlawful probationary purge, losing their jobs did not just mean losing a paycheck. It meant losing a career trajectory that many had spent years, and in some cases decades, carefully building. The data makes clear that re-entering the workforce after federal employment is far harder than many anticipated.
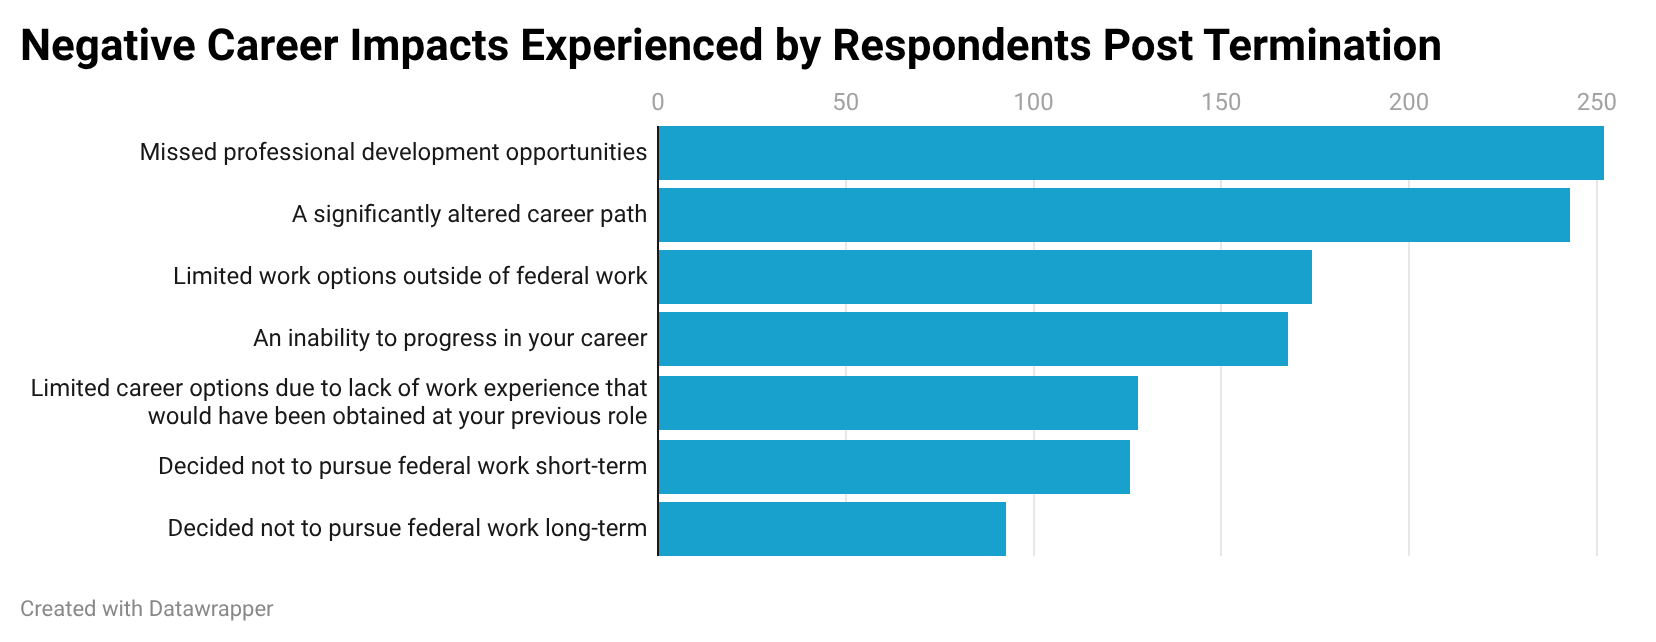
Graph 1 — Negative Career Impacts Experienced by Federal Workers Post Termination The most commonly reported career impact was missed professional development opportunities, cited by hundreds of fired federal workers. A significantly altered career path was reported by nearly as many, followed by limited work options outside of federal employment and an inability to progress in their careers. A substantial number also reported limited career options due to lack of work experience that would have been gained in their previous role, and a meaningful group said they decided not to pursue federal work again, either short or long term, reflecting deep and lasting damage to the federal talent pipeline.
The most commonly reported career impact was missed professional development opportunities, cited by hundreds of fired federal workers. Nearly as many reported a significantly altered career path, followed by limited work options outside of the federal workforce and an outright inability to progress in their careers. A significant number also reported that they decided not to pursue federal work again, either in the short or long term, representing a profound and lasting loss of public service talent that the government may never recover.
The job search data tells a story of exhaustion and repeated rejection. The single largest group of fired federal workers reported submitting over 100 job applications in their search for new work, with many submitting far more. Despite this relentless effort, interviews were hard to come by, with most workers reporting only a handful of interviews total. Job offers were even scarcer, with the majority receiving just one, and a heartbreaking number receiving none at all.
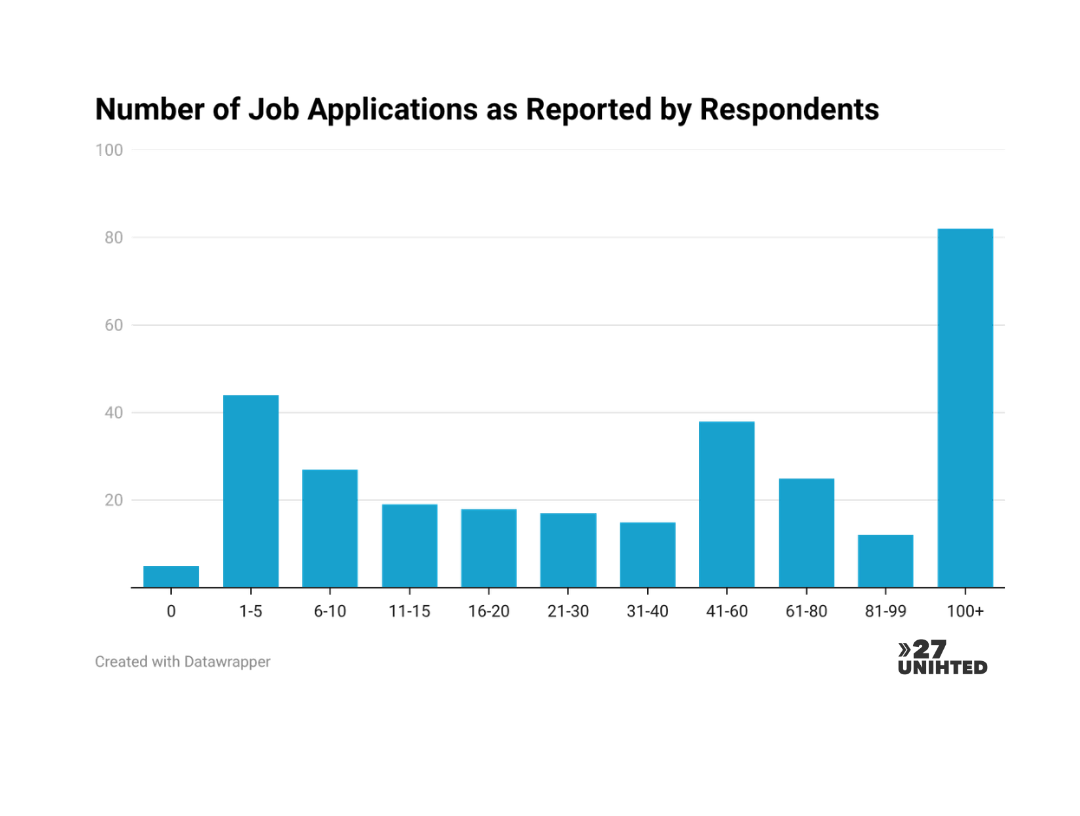
Graph 3 — Number of Job Applications as Reported by Federal Workers The single largest group of fired federal workers reported submitting over 100 job applications in their search for new employment, with many submitting far more. Significant numbers also reported submitting between 31 and 80 applications. Only a small number reported submitting fewer than 5, a stark reflection of just how difficult and prolonged the job search became for this population.
For workers who were reinstated following court orders, the obstacles did not end there. One hundred and forty eight individual federal workers reported being unable to obtain appropriate documentation of their termination. Eighty nine could not obtain documentation of their termination or reinstatement that complied with court orders. Thirty two were denied a new role within the federal government entirely. Performance ratings were restricted, backpay was withheld, and some workers were placed back on administrative leave and still blocked from returning to work, sometimes for weeks.
The human cost behind these numbers is profound. These were not workers who could easily pivot to comparable private sector roles. Many had spent their entire careers developing highly specialized expertise in fields like marine science, public health research, environmental law, and national security, skills that have limited direct equivalents outside of government. For them, this firing was not a setback. It was a rupture.
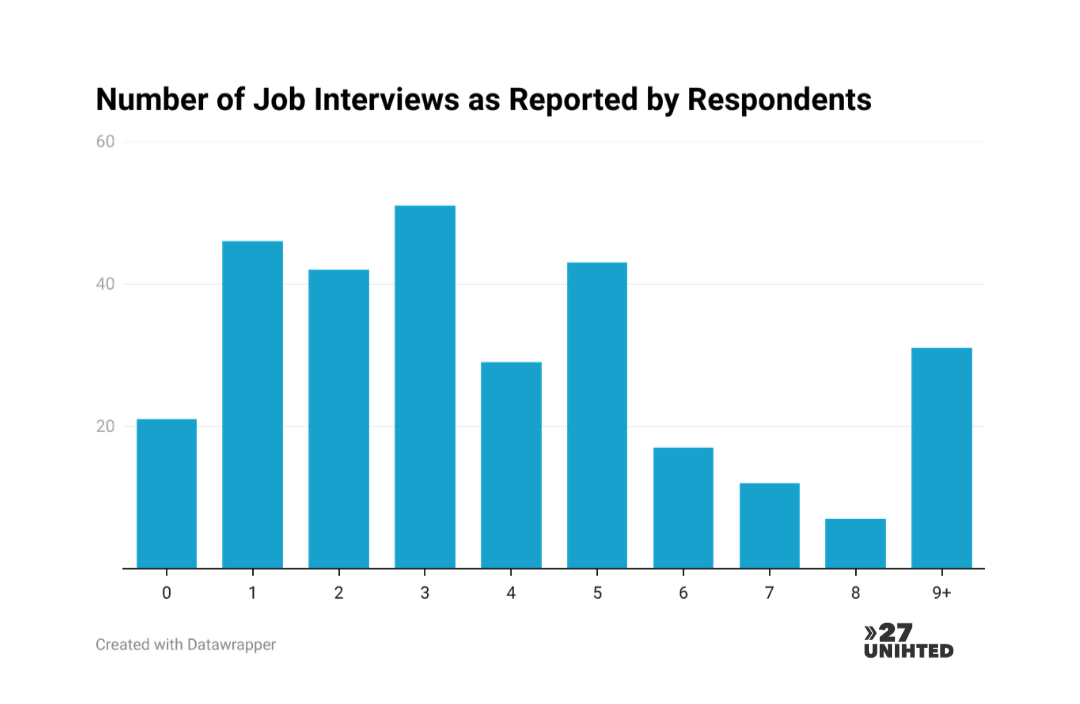
Graph 4 — Number of Job Interviews as Reported by Federal Workers Despite submitting dozens or even hundreds of applications, most fired federal workers reported receiving only a handful of interviews. The highest concentration fell between one and four interviews total. A smaller group reported nine or more, while roughly 20 reported receiving no interviews at all, a devastating outcome for workers with years of specialized public service experience.
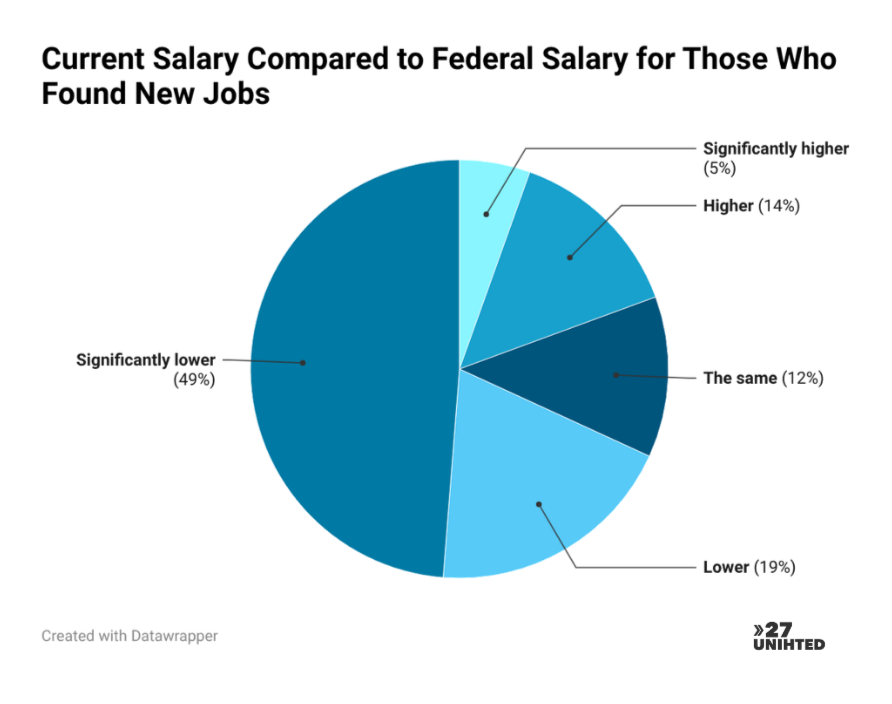
Graph 6 — Current Salary Compared to Federal Salary for Those Who Found New Jobs Of fired federal workers who found new employment, 49% reported their current salary was significantly lower than what they earned in their federal role, and an additional 19% reported it was lower. Only 12% reported earning the same, 14% reported earning higher pay, and just 5% reported earning significantly higher. In total, nearly 68% of those who found new work took a pay cut, a staggering financial consequence for workers who were already earning less than their private sector counterparts when they chose public service.
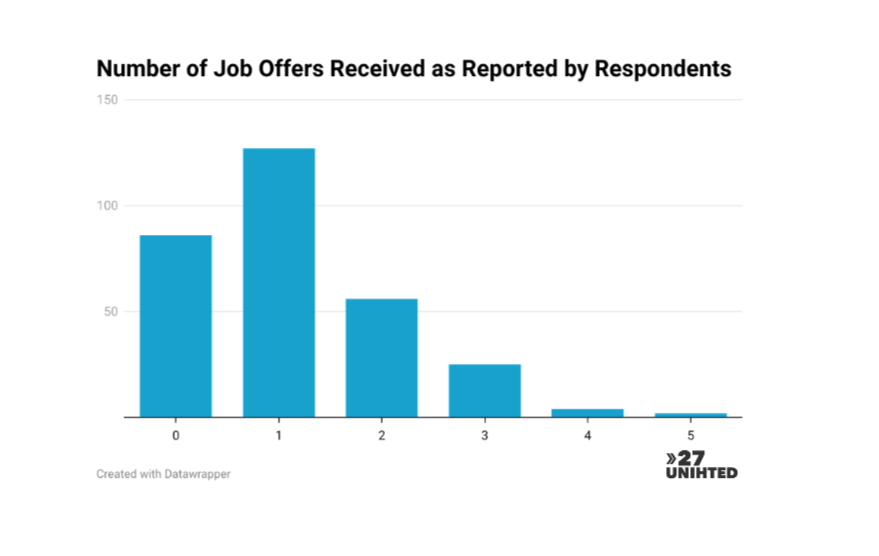
Graph 5 — Number of Job Offers Received as Reported by Federal Workers The majority of fired federal workers received only one job offer after months of searching, and a large number received none at all. Offers dropped off sharply above two, with very few workers receiving three or more. For a population with advanced degrees, specialized expertise, and years of dedicated public service, this data reflects how narrow and unforgiving the path back to comparable employment has been.
For those who did find new employment, the financial toll was severe. 49% saw their salary drop significantly, and an additional 19% took a pay cut as well. In total, nearly 68% of those who found work earned less than they did in their federal roles. Only a small fraction landed positions at the same or higher pay.
Unemployment was not a brief transition for most. While some found work within the first month or two, large numbers remained out of work for four, five, six months or longer. The largest single group in the entire dataset were those who were still unemployed at the time of the survey, nearly a full year after being illegally fired.

Graph 7 — Number of Months Federal Workers Were Unemployed For most fired federal workers, unemployment stretched far beyond a brief transition. While some found work within the first month or two, large numbers remained out of work for three to five months or longer. The largest single group in the entire survey were those still unemployed at the time of completing it, nearly a full year after their termination, a devastating outcome that no statistic alone can fully capture.
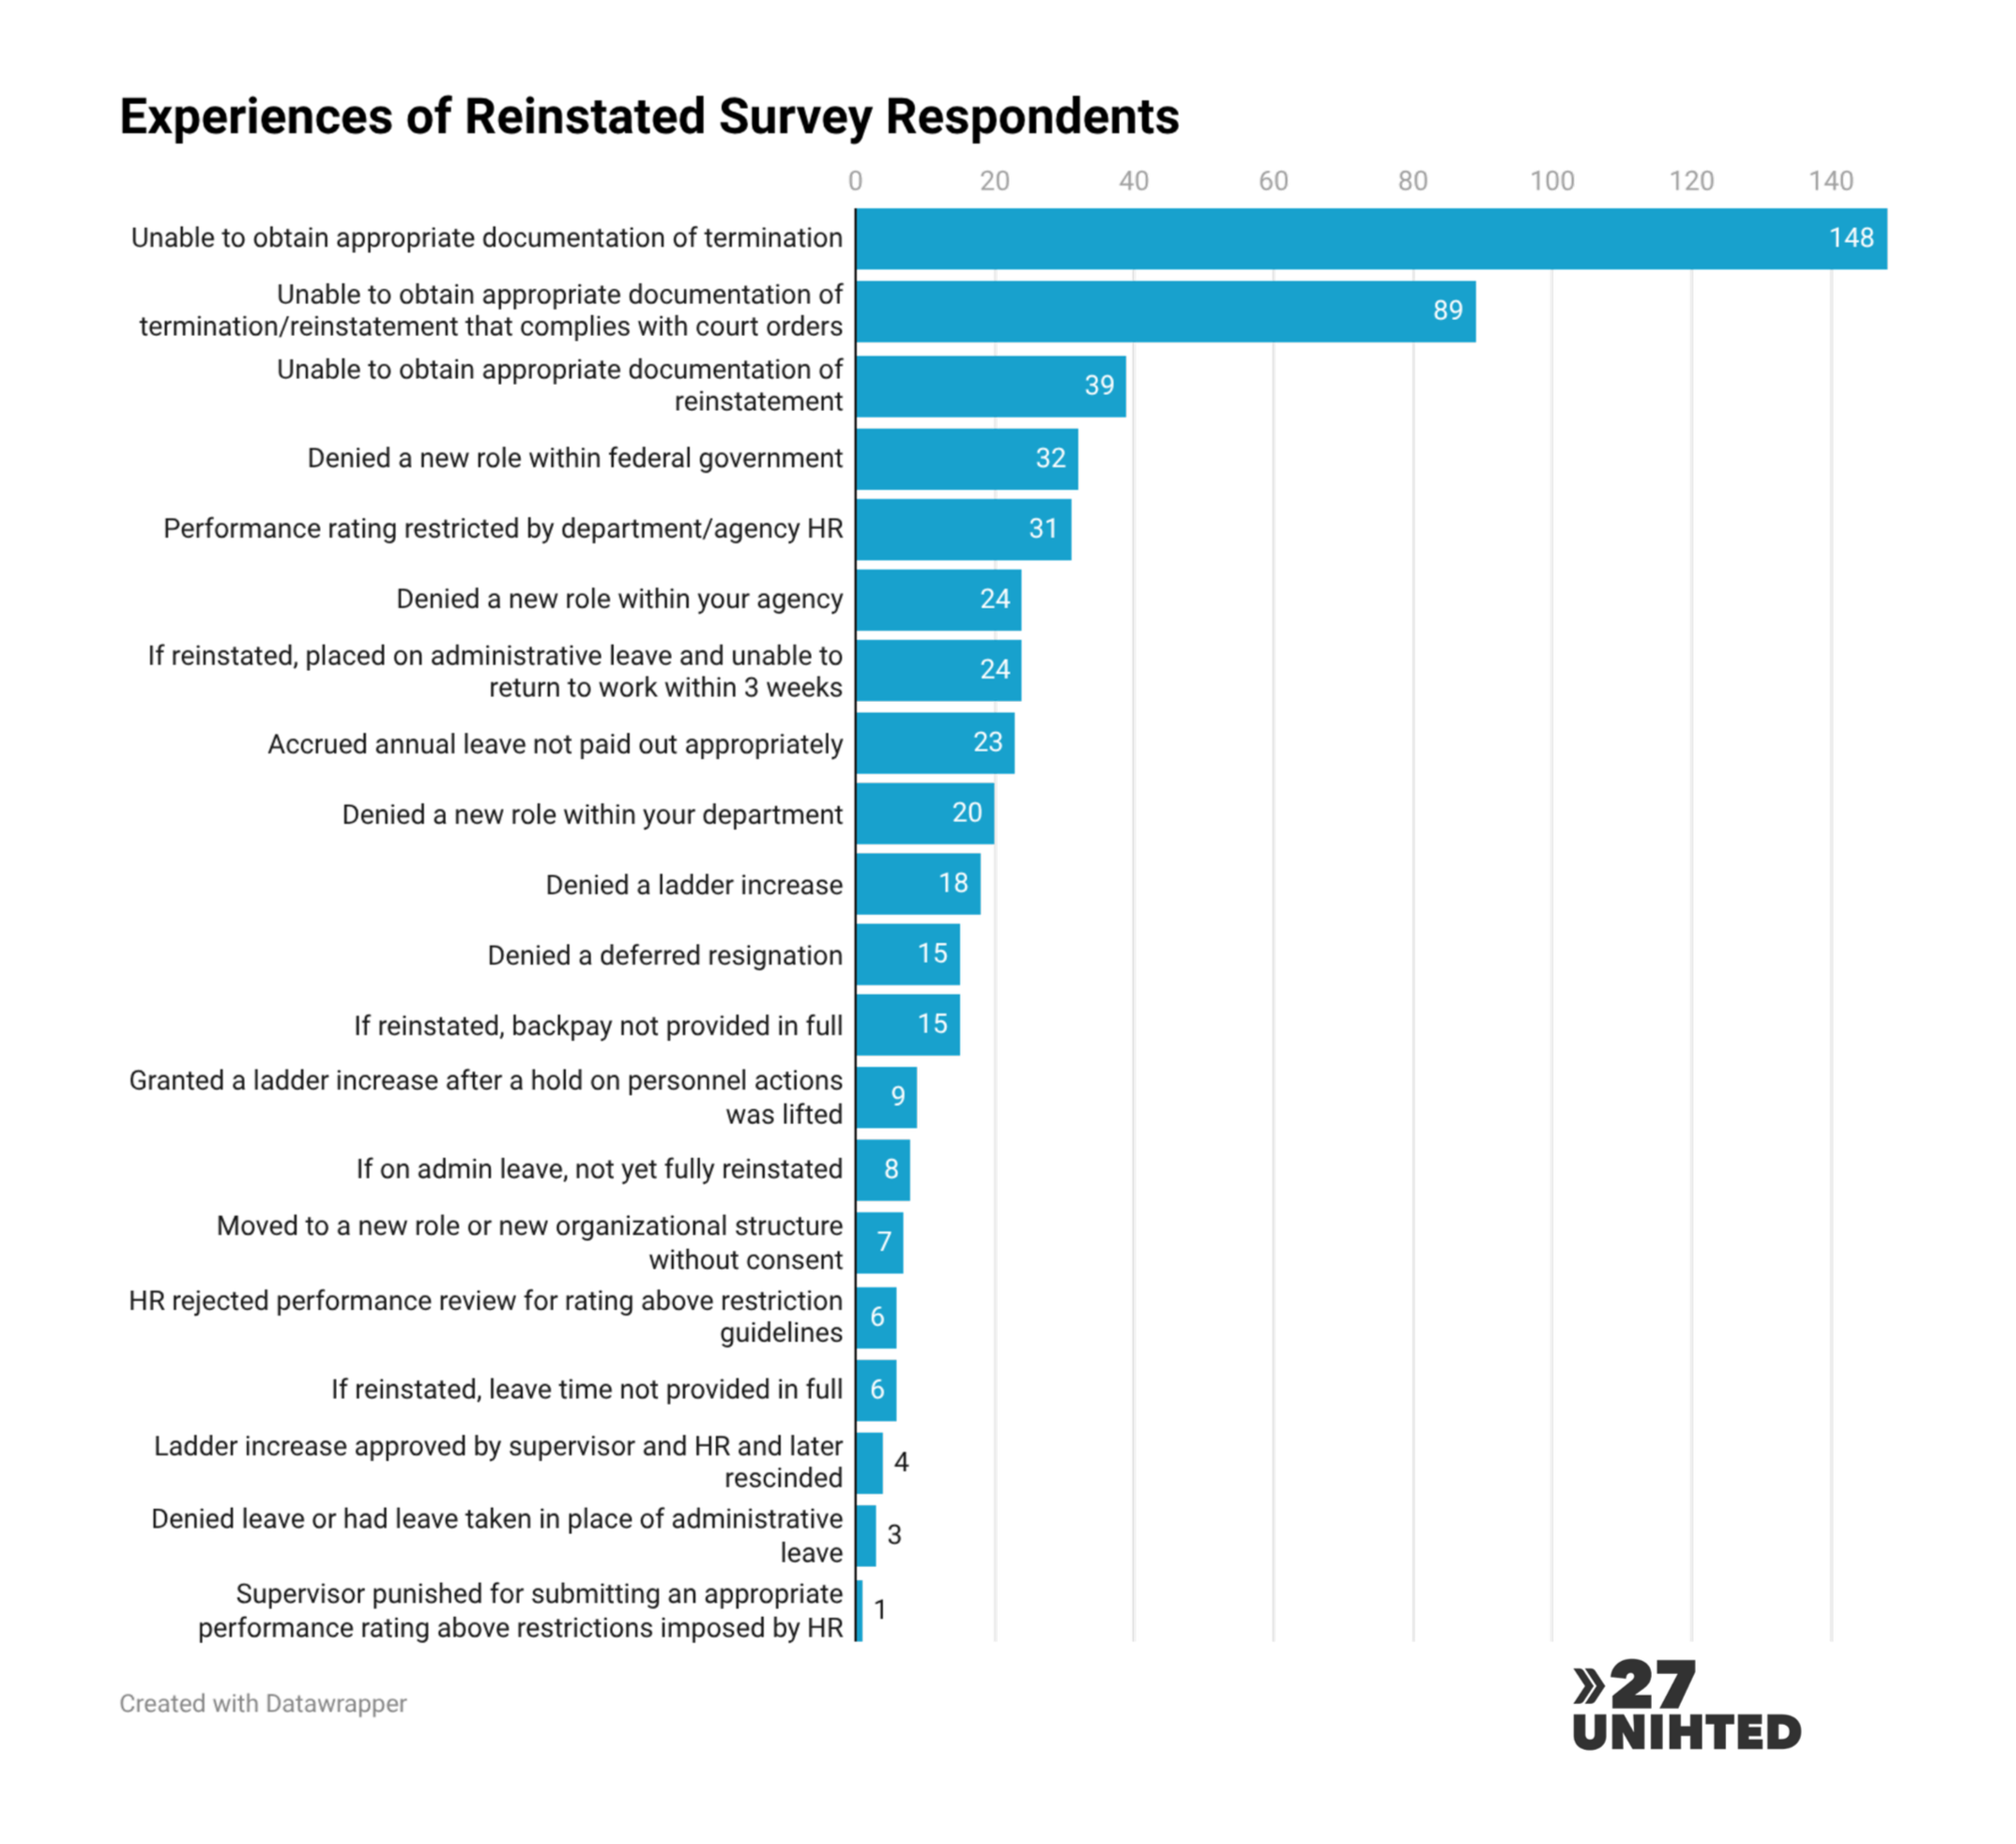
Graph 8 — Experiences of Reinstated Federal Workers Even for those reinstated following court orders, the obstacles did not stop. One hundred and forty eight individual federal workers were unable to obtain appropriate documentation of their termination. Eighty nine could not obtain documentation of their termination or reinstatement that complied with court orders. Thirty nine were unable to obtain reinstatement documentation at all. Thirty two were denied a new role within the federal government, and thirty one had their performance ratings restricted by agency HR. Additional impacts included denied ladder increases, withheld backpay, placement on administrative leave with no ability to return to work, and in one documented case, a supervisor was punished for submitting a performance rating above the restrictions imposed by HR.